3 Key Manufacturing Sectors to Target for Reaching Paris Agreement's Goal

global-warming-2034896_1280.jpg

According to IPCC, the industry sector accounts for about a third of the world’s total anthropogenic greenhouse gas (GHG) emissions (after allocating electricity-related emission to end use sectors). This is by far greater than GHG emissions from the Building and Transportation sector, yet these two sectors often get more attention than the industry sector.

AFOLU: Agriculture, Forestry and Other Land Use Figure 1. The share of GHG emissions by economic sector (IPCC 2014)

AFOLU: Agriculture, Forestry and Other Land Use
Figure 1. The share of GHG emissions by economic sector (IPCC 2014)

Unlike building and transportation sector, the manufacturing sector is more complex which involves tens of industry subsectors that are vastly different from each other with regards to the production technologies and systems they use. It looks like this complexity drives many people and organizations away from the industry sector. However, without seriously tackling the energy use and GHG emissions in the industry sector, we will absolutely fail to meet the goals of Paris Climate Agreement.

Within the industry sector, there are many industry subsectors. Figure 2 below shows a high-level classification of industry subsector. Among these, there are only 3 industry subsectors that account for over 62% of total final energy use in industry sector worldwide. These three sectors are:

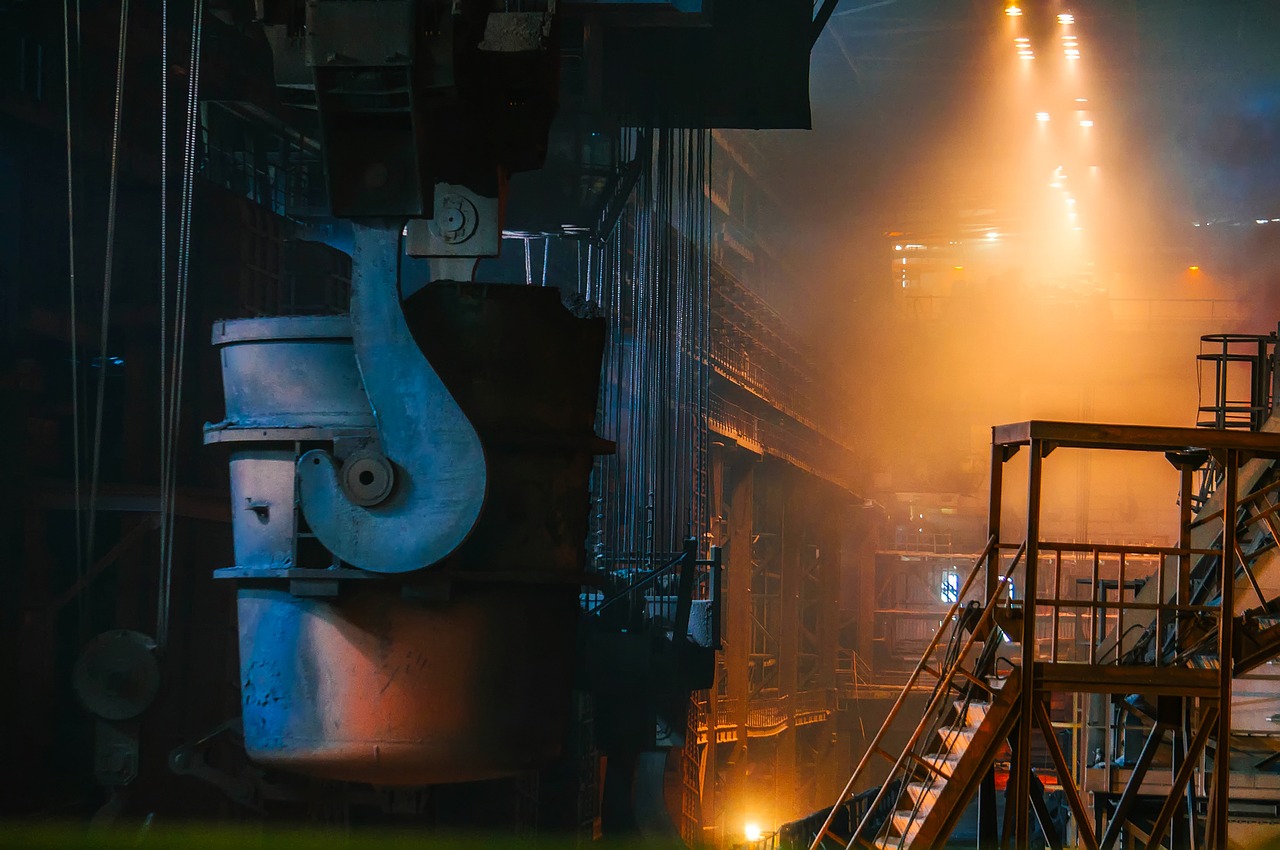
  1. Iron and steel industry

  2. Chemical and petrochemical industry

  3. Non-metallic minerals industry, which is mainly the cement industry, but also includes glass, lime and other smaller subsectors

In terms of GHG emissions, these three manufacturing subsectors, i.e. iron and steel industry, chemical and petrochemical industry, and cement industry account for even larger share, over 65% of total industry sector GHG emissions. This is because of high levels of non-energy related GHG emissions (or process emissions) from these three subsectors particularly the cement industry. Worldwide, around 63% of total GHG emissions from the cement industry is process-related emissions (from chemical reaction during calcination process), which are not included in the Figure 2 below.

Figure 2. The share of different industry subsector from total industry use in the world in 2014 (IEA 2017a)

Figure 2. The share of different industry subsector from total industry use in the world in 2014 (IEA 2017a)

What makes the matter worse is the high share of fossil fuels, especially coal used in the industry sector. Coal accounts for over 75% of the final energy used in the steel industry worldwide with another 10% of energy coming from natural gas and oil (IEA 2017a). In the cement industry worldwide, coal account for over 60% final energy use and natural gas and oil account for another 15% of total energy use (IEA 2018).

The other point to keep in mind is that with world’s population increasing from 7.6 billion in 2018 to around 10 billion people in 2050 with majority of population increase to happen in developing economies, the absolute demand for cement, steel, and chemicals is expected to increase significantly by 2050.

While many people are hoping that we will clean the electricity grid and then electrify almost everything, thereby addressing the climate change issue, this is far more complex in manufacturing sector compared with the building and transportation sector. First, as mentioned above, industry sector with many subsectors which are quite different technologically will need many different types of electrification technologies. Second, around 74% of the final energy used in industry sector is fuel from which almost 48% is used for high temperature heat (above 400 Degrees Celsius) most of which is used in the steel and cement industry among others (Figure 3).  Electrifying this high temperature heat demand has proved to be difficult in these 3 industry subsectors.

Figure 3. Share of energy use by economic sector (left) and breakdown of heat demand in industry (right) (IEA 2017b)

Figure 3. Share of energy use by economic sector (left) and breakdown of heat demand in industry (right) (IEA 2017b)

In summary, without decarbonizing the iron and steel, chemical and petrochemical, and cement industry, it is impossible to reach the Paris Climate Agreement’s goals and peak the total GHG emissions early enough to keep the temperature rise below 2 degrees Celsius. Therefore, we need more focused attention by public and private sectors as well as NGOs and philanthropists to gather and allocate resources to reduce GHG emissions in these 3 industry subsectors. The time is running out with regards to climate change mitigation timeline and peaking world’s GHG emissions. We need to focus on areas where we can get huge savings and gigaton scale GHG emissions reduction.  If we don’t, scientists have given us some clear dire warnings!

Don't forget to Follow us on LinkedIn and Facebook to get the latest about our new blog posts, projects, and publications.

Also read our related blog posts:

See the list of some of our related publications for the iron and steel, cement, and chemical industry from this link.

Sources:
IEA/WBCSD. 2018. Technology Roadmap-Low-Carbon Transition in the Cement Industry.
IEA. 2017a. Global Iron & Steel Technology Roadmap.
IEA. 2017b. Renewable Energy for Industry.
IPCC. 2014: Summary for Policymakers. In: Climate Change 2014: Mitigation of Climate Change.


Infographic: Deep Electrification of Manufacturing Industries

flash-113310_1920.jpg

Over 50% of final energy demand globally is for heating. Around half of that is for heating demands in the industry sector. When talking about electrification, the focus has mostly been on the transportation and to some extend building sectors. The industry sector has often been ignored when considering deep electrification. Even if we electrify the heat demand for the entire transportation sector and building sector in the world, that only covers 30% and 25% of world’s final energy use, respectively.

The infographic below highlights some general aspects of electrification in the industry sector. There is a substantial need for more research and analysis on electrification potential in different industry subsectors and electrification technology R&D for the manufacturing sector.

Don't forget to Follow us on LinkedIn and Facebook to get the latest about our new blog posts, projects, and publications. Also, you can join our Electrification & RE in Manufacturing group on LinkedIn to get more information.

To download the high resolution image file (JPEG) of the infographic, click here.

Deep_Electrification_of_Manufacturing_Industries01.jpg

What’s the Embodied Carbon in the U.S.-China Trade?

Authors: Ali Hasanbeigi, Daniel Moran

President Donald Trump has just signed an executive order to levy tariffs on a wide range of Chinese products worth an estimated $50 billion. This will certainly have major trade implications not only between China and the U.S., but globally. Perhaps, that’s why a major sell-off is happening in global stock markets. We thought to take this opportunity to look at it from climate change perspective. Do you know what’s the embodied carbon in the trade between the U.S. and China?

In our recent study on Embodied Carbon in Globally Traded Goods funded by the ClimateWorks Foundation, Global Efficiency Intelligence, LLC. and KGM & Associate Ltd. used the most recent available data and a cutting-edge model (Eora MRIO) to conduct a global assessment of the extent of the embodied carbon in globally traded goods, so-called carbon loophole.

The graph below highlights our finding related to embodied carbon in the trade between U.S. and China in 2015. As it is illustrated, the embodied carbon in goods that U.S. imports from China is around 502 million ton of CO2, while the embodied carbon in goods China imports from the U.S. is around 67 million ton of CO2. Therefore, the net import of embodied carbon by the U.S. from China is around 435 million ton of CO2.

To put this number in perspective, the entire GHG emissions in California (the 5th largest economy in the world) in 2015 was 440 million ton of CO2.


Source: KGM & Associate and Global Efficiency Intelligence analysisFigure. Embodied Carbon in the U.S.-China Trade in 2015 (Million ton CO2)

Source: KGM & Associate and Global Efficiency Intelligence analysis

Figure. Embodied Carbon in the U.S.-China Trade in 2015 (Million ton CO2)

It is hard, however, to quantify the carbon implication of this new U.S. tariff on imports from China without knowing the exact list of products affected and how the tariff will change the trade balance between the U.S. and China.

A tool like the U.S. tariff on imports could be good for the climate and the economy if it was based on the carbon footprint of the goods imported and was not just implemented as a blanket tariff. In fact, California recently passed the Buy Clean legislation (AB 262), which calls for the state to create rules for the procurement of infrastructure materials (steel, glass, etc.) purchased with state funds that take into account pollution levels during production. This could be an example of environmental- and climate-friendly procurement and trade tariffs that level the playing field and can benefit both industry and the environment and incentivize high polluting companies that are out-of-state or out-of-country to clean up their production in order to be able to trade with these states or countries.

The report of our study on Embodied Carbon of Globally Traded Goods which includes results for trade between other countries and regions of the world is available to download from this link.

Don't forget to Follow us on LinkedIn and Facebook to get the latest about our new blog posts, projects, and publications.

Also read our related blog posts:


Infographic: The Embodied Carbon in Global Steel and Cement Trade

Authors: Ali Hasanbeigi, Daniel Moran, Prodipto Roy

container-1638068_1280.jpg

President Trump just signed an executive order to impose a 25% tariff on steel imports and 10% on aluminum imports to the U.S. While many people are discussing how this can lead to a trade war between certain nations, we decided to take a look at it through the lens of embodied carbon in traded goods.

The UNFCCC’s greenhouse gas (GHG) accounting system works on the basis of national production rather than consumption of emissions. This means that when goods are traded, their embodied emissions (e.g. emissions associated with manufacture) are also traded. However, these imported emissions are not counted towards a country’s reported climate impacts. It is estimated that around 25% of global CO2 emissions comprise goods and services which have been internationally traded.

In the recent study on Embodied Carbon in Globally Traded Goods funded by the ClimateWorks Foundation, Global Efficiency Intelligence, LLC. and KGM & Associate Ltd. use the most recent available data and a cutting-edge model to conduct a global assessment of the extent of the embodied carbon in globally traded goods, so-called carbon loophole. In addition, we have conducted a series of higher-resolution, deeper dive case studies into a few key sectors and geographies of most importance, including steel and cement.

The infographic below summarizes some of our key findings related to deep-dive analysis we conducted for embodied carbon in global steel and cement trade. As it is illustrated, steel trade accounts for a significant amount of embodied carbon in trade. Even though China doesn’t feature in the top three steel import sources for the United States (Canada, Brazil, and South Korea occupy the top three spots), China still accounts for 40% of carbon embodied in the global commodity steel extra-regional trade, and 27% of carbon embodied in overall commodity steel trade.

One of the frustrations of U.S. steelmakers, which led to their support of the U.S. tariff, was China systematically overproducing subsidized steel and flooding the international markets. Furthermore, many steel manufacturers in China and other steel exporting countries like the Commonwealth of Independent States (CIS) produce a comparable unit of steel using significantly more carbon and energy than their cleaner counterparts in their own country or region. We see this disparity of carbon use in production not only in countries like China but also within different states in the U.S.

A tool like the U.S. tariff on steel imports could be good for the climate and the economy if it was based on the carbon footprint of the steel imported and was not just implemented as a blanket tariff. In fact, California recently passed the Buy Clean legislation (AB 262), which calls for the state to create rules for the procurement of infrastructure materials (including steel) purchased with state funds that take into account pollution levels during production. This could be an example of environmental- and climate-friendly procurement and trade tariffs that level the playing field and can benefit both industry and the environment and incentivize high polluting companies that are out-of-state or out-of-country to clean up their production in order to be able to trade with these states or countries.

The study on Embodied Carbon of Globally Traded Goods will be published in September 2018.

Don't forget to Follow us on LinkedIn and Facebook to get the latest about our new blog posts, projects, and publications.

Infograph-Embodied_Carbon_in_Steel_and_Cement_Trade-Final-Small.jpg

Decarbonization Roadmap for California’s Cement and Concrete Industry

california-160550_640.png

The cement industry accounts for over 5 percent of current man-made carbon dioxide emissions worldwide. World cement demand and production are increasing; annual world cement production is expected to grow from approximately 4,100 million tonnes (Mt) in 2015 to around 4,800 Mt in 2030 and grow even further after that. The largest share of this growth will take place in developing countries, especially in the Asian continent.

According to USGS, United States produced around 86 Mt of cement in 2016 making it the third largest cement producer in the world after China and India. The state of California has 10 cement plants that together produced around 10 Mt of cement in 2015 making it the second largest cement producing state in the U.S. after Texas. This significant cement production in California is associated with a substantial energy use and greenhouse gas (GHG) emissions in the state. The cement industry in California is the largest consumer of coal in the state. Therefore, there is a need to develop a roadmap on how to reduce energy use and GHG emissions related to cement and concrete production in California.

Given our extensive experience in this area, Global Efficiency Intelligence, LLC is conducting a study for the Sierra Club to develop a roadmap for decarbonizing California’s cement and concrete industry. In this study, we will look into current status of the cement and concrete production in California and conduct a benchmarking analysis for the energy use and emissions of the cement industry in California in comparison with some other key cement producing countries. In addition, we will look into options that can help to decarbonize the cement and concrete production in California such as energy efficiency, fuel switching, alternative raw material and products, and carbon capture, utilization, and storage (CCUS).

Don't forget to Follow us on LinkedIn and Facebook to get the latest about our new blog posts, projects, and publications.

Also read our related blog posts:

Some of our related publications are:

  • Hasanbeigi, Ali; Agnes Lobscheid; Hongyou, Lu; Price, Lynn; Yue Dai (2013). Quantifying the Co-benefits of Energy-Efficiency Programs: A Case-study for the Cement Industry in Shandong Province, China. Science of the Total Environment. Volumes 458–460, 1 August 2013, Pages 624-636.

  • Hasanbeigi, Ali; Morrow, William; Masanet, Eric; Sathaye, Jayant; Xu, Tengfang. 2013. Energy Efficiency Improvement Opportunities in the Cement Industry in China. Energy Policy Volume 57, June 2013, Pages 287–297

  • Morrow, William; Hasanbeigi, Ali; Sathaye, Jayant; Xu, Tengfang. 2014. Assessment of Energy Efficiency Improvement and CO2 Emission Reduction Potentials in India’s Cement and Iron & Steel Industries. Journal of Cleaner Production. Volume 65, 15 February 2014, Pages 131–141

  • Hasanbeigi, Ali; Menke, Christoph; Therdyothin, Apichit (2010). Technical and Cost Assessment of Energy Efficiency Improvement and Greenhouse Gas Emissions Reduction Potentials in Thai Cement Industry. Energy Efficiency. DOI 10.1007/s12053-010-9079-1

  • Hasanbeigi, Ali; Menke, Christoph; Therdyothin, Apichit (2010). The Use of Conservation Supply Curves in Energy Policy and Economic Analysis: the Case Study of Thai Cement Industry. Energy Policy 38 (2010) 392–405

  • Hasanbeigi, Ali; Price, Lynn; Hongyou, Lu; Lan, Wang (2010). Analysis of Energy-Efficiency Opportunities for the Cement Industry in Shandong Province, China: A Case-Study of Sixteen Cement Plants. Energy-the International Journal 35 (2010) 3461-3473.

Utilities and Governments are Wasting Millions of Dollars Subsidizing A Wrong Technology for Motor Systems Efficiency

wasting-money-670x335.jpg

According to the International Energy Agency (IEA), electric motor systems consume more than half of global electricity. Industrial electric motor systems account for over 70% of total global industrial electricity usage. Electric motors operate fans; pumps; and materials-handling, compressed-air, and processing equipment.

Because motor efficiency improvements will only marginally increase the motor system’s efficiency, we must look to improve the efficiency of the equipment and systems being driven by the motor. Optimization measures such as predictive maintenance, avoiding oversized motors, and matching motor systems to specific needs, etc. could improve the energy efficiency of motor-driven systems significantly. Even more savings can be achieved by looking not only beyond the motor to the whole motor system but beyond the system to the end-use device, as shown in Figure below.

Figure. Illustration of two industrial electric motor-driven systems: (a) normal and (b) efficient (IEA 2016)

Figure. Illustration of two industrial electric motor-driven systems: (a) normal and (b) efficient (IEA 2016)

The traditional approach in most states and countries has been to focus on motors only and not on entire motor systems. As shown above, while increasing motor efficiency saves energy, optimizing the entire pump system will save much more energy. There is a need to shift the paradigm to focus on systems rather than individual motor efficiency. Programs and policies that target systems can save more energy and CO2 emissions in a more cost-effective manner than programs that focus only on motors.

Many utilities in the U.S. and governments around the world give substantial rebate for replacing electric motors with more efficient ones. While this may sound like a good thing to do, our extensive studies for 30 states in the U.S. and over 10 countries around the world shows that it is a clear waste of money. Why? Because in most cases, replacing existing motor with a more efficient one can improve the entire system efficiency by 1% - 5% (depending on the baseline efficiency of the systems). On the other hand, there are many other systems efficiency/optimization measures that can result in up to 20% - 25% efficiency improvement in the system.

pump-1758554_1920.jpg

For example, in a pump system with a Low efficiency baseline, replacing motor can only improve system efficiency by 5%, while trimming or changing impeller to match output to requirements can save about 15%, removing sediment/scale buildup from piping can save about 10% and installing variable speed drive (VSD) can save about 25% of the electricity use.

There is another very important reason why giving rebate for replacing motors with more efficient ones is such a waste of money in a massive scale. Our analysis consistently showed that replacing motor with more efficient one is by far one of the least cost-effective efficiency measures that can be implement on a motor system (for example in a pump systems or a fan systems). In other words, it cost much higher to save a kWh of electricity by replacing motor than to implement other system efficiency/optimization measures.

So, you might ask why many utilities and government prioritize giving rebate for replacing motors? The answer is it’s easier to implement and measure the saving. Utilities and government staff and program managers often need to show the amount of electricity saved as a result of implementing a rebate program. This is easier to do with equipment replacement than with soft measures such as system optimization. Having this said, many of the system optimization measures are easy to implement by in-house staff in the facilities.

To sum up, our detailed and extensive studies for three major industrial motor systems (pump systems, fan systems, and compressor systems) shows that millions of dollars spent annually by utilities and governments on rebate program for replacing electric motors with more efficient one is clearly waste of public and private funding. The better way would be to provide rebate for system efficiency measures that can save sometime up to 10 times higher energy saving with lower cost.

If utilities and governments persist to keep their motor replacement rebate program, my suggestion to them, based on the findings of our reports, is to bundle one or two efficiency measures with the motor replacement rebate. In other words, for an applicant to quality for motor replacement rebate, they should also implement one or two other system optimization measures from a list of measures that is predefined by utilities or government agencies.

To find out more about our detailed bottom-up studies for energy efficiency in industrial motor systems in the U.S., see our reports:

U.S. Industrial Motor Systems Energy Efficiency Reports Covering 30 States >>

Don't forget to Follow us on LinkedIn and Facebook to get the latest about our new blog posts, projects, and publications.

References:

IEA. 2016. World Energy Outlook 2016. Paris, France.
IEA, 2011. Energy efficiency policy opportunities for electric motor driven systems. Paris, France.


Aluminum Industry: 10 Emerging Technologies for Energy-efficiency and GHG Emissions Reduction

foil-782.jpg

Aluminum production is one of the most energy-intensive industrial processes worldwide. Although about a third of global aluminum production uses electricity from hydropower sources, the increasing use of coal as the primary fuel for electricity for aluminum production in many countries means that aluminum production is still a significant source of greenhouse gas (GHG) and greenhouse gas  emissions. According to the International Energy Agency (IEA), the aluminum industry accounts for about 1% of global GHG emissions (IEA 2012).

Annual world aluminum demand is expected to increase two- to three-fold by 2050. The bulk of growth in consumption of aluminum will take place in China, India, the Middle East, and other developing countries, where consumption is expected to nearly quadruple by 2025. To meet this increased demand, production is projected to grow from approximately 51 million tonnes (Mt) of primary aluminum in 2014 to 89-122 Mt in 2050 (IEA 2012). This increase in aluminum consumption and production will drive significant growth in the industry’s absolute energy use and GHG emissions.

Studies have documented the potential to save energy by implementing commercially-available energy-efficiency technologies and measures in the aluminum industry worldwide. However, today, given the projected continuing increase in absolute aluminum production, future reductions (e.g., by 2030 or 2050) in absolute energy use and GHG emissions will require further innovation in this industry. Innovations will likely include development of different processes and materials for aluminum production or technologies that can economically capture and store the industry’s GHG emissions. The development of these emerging technologies and their deployment in the market will be a key factor in the aluminum industry’s mid- and long-term climate change mitigation strategies.

Many studies from around the world have identified sector-specific and cross- energy-efficiency technologies for the aluminum industry that have already been commercialized. However, information is scarce and scattered regarding emerging or advanced energy-efficiency and low-carbon technologies for the aluminum industry that have not yet been commercialized.

In 2016, Cecilia Springer of Lawrence Berkeley National Laboratory and I wrote a report that consolidated available information on emerging technologies for the aluminum industry with the goal of giving engineers, researchers, investors, aluminum companies, policy makers, and other interested parties easy access to a well-structured database of information on this topic.

Information about 10 emerging technologies for the aluminum industry was covered in the report and was presented using a standard structure for each technology. Table below shows the list of the technologies covered.

Table 1. Emerging energy-efficiency and CO2 emissions-reduction technologies for the aluminum industry (Springer and Hasanbeigi, 2016)

Picture2.png

Shifting away from conventional processes and products will require a number of developments including: education of producers and consumers; new standards; aggressive research and development to address the issues and barriers confronting emerging technologies; government support and funding for development and deployment of emerging technologies; rules to address the intellectual property issues related to dissemination of new technologies; and financial incentives (e.g. through carbon trading mechanisms) to make emerging low-carbon technologies, which might have a higher initial costs, competitive with the conventional processes and products.

Our report is published on LBNL’s website and can be downloaded from this Link. Please feel free to contact me if you have any question.

Don't forget to Follow us on LinkedIn and Facebook to get the latest about our new blog posts, projects, and publications.

Some of our related publications are:

1.     Hasanbeigi, Ali (2013). Emerging Technologies for an Energy-Efficient, Water-Efficient, and Low-Pollution Textile Industry. Berkeley, CA: Lawrence Berkeley National Laboratory. LBNL-6510E

2.     Hasanbeigi, Ali; Arens, Marlene; Price, Lynn; (2013). Emerging Energy Efficiency and CO2 Emissions Reduction Technologies for the Iron and Steel Industry. Berkeley, CA: Lawrence Berkeley National Laboratory BNL-6106E.

3.     Kong, Lingbo; Hasanbeigi, Ali; Price, Lynn (2012). Emerging Energy Efficiency and Greenhouse Gas Mitigation Technologies for the Pulp and Paper Industry. Berkeley, CA: Lawrence Berkeley National Laboratory. LBNL-5956E.

4.     Hasanbeigi, Ali; Price, Lynn; Lin, Elina. (2012). Emerging Energy Efficiency and CO2 Emissions Reduction Technologies for Cement and Concrete  Production. Berkeley, CA: Lawrence Berkeley National Laboratory LBNL-5434E.

References:

Springer, Cecilia; Hasanbeigi, Ali and Price, Lynn (2016). Emerging Energy Efficiency and CO2 Emissions Reduction Technologies for the Aluminum Industry. Berkeley, CA: Lawrence Berkeley National Laboratory. LBNL-1005789

·      International Energy Agency, and Organisation de coopération et de développement économiques. 2012. Energy Technology Perspectives: Scenarios & Strategies to 2050 : In Support of the G8 Plan of Action. Paris: OECD, IEA.


Global Efficiency Intelligence and UNIDO are Helping Egypt to Improve Industrial Energy Efficiency

pyramids-2159286_1280.jpg

Egypt is the largest oil and natural gas consumer in Africa, accounting for about 20% of petroleum and other liquids consumption and around 40% of natural gas consumption in Africa. Increased industrial output, economic growth, energy-intensive natural gas and oil extraction industry, rapid population growth, rapid increase in vehicle sales, and energy subsidies are among key factors contributed to the rapid growth of energy consumption over the past few decades in Egypt.

Industry sector accounted for over 42% of natural gas, 86% of fuel oil, and 25% of total electricity consumption in Egypt in 2015. industrial electric motor systems account for over 70% of manufacturing electricity consumption.

Given its extensive experience on motor systems energy efficiency analysis, Global Efficiency Intelligence, LLC. has been working on a project for United Nations Industrial Development Organization (UNIDO) to conduct a study on electricity saving potential in industrial motor systems in Egypt. We are analyzing energy use, energy efficiency, and GHG emissions-reduction potential in industrial pump systems, fan systems, and compressed-air systems, which together account for over 70% of electricity use in industrial motor systems in Egypt. We will assess the cost-effectiveness of series of energy conservation measures that can be implemented on these motor systems in Egypt.

Don't forget to Follow us on LinkedIn and Facebook to get the latest about our new blog posts, projects, and publications.


Infographic: Textile and Apparel Industry’s Energy and Water Consumption and Pollutions Profile

post-impressionist-1428139_1280.jpg

Although the textile and apparel industry is not considered an energy-intensive industry, it comprises a large number of plants that, together, consume a significant amount of energy which result in substantial greenhouse gas (GHG) emissions too. 


The textile and apparel industry and especially textile wet-processing is one of the largest consumers of water in manufacturing and also one of the main producers of industrial wastewater. Since various chemicals are used in different textile processes like pre-treatment, dyeing, printing, and finishing, the textile wastewater contains many toxic chemicals which if not treated properly before discharging to the environment, can cause serious environmental damage.

With global population growth and the emergence of fast fashion, the worldwide textile and apparel production are increasing rapidly. In 2014, an average consumer bought 60% more clothing compared to that in 2000, but kept each garment only half as long.

The Infographic below shows the Textile and Clothing Industry’s Energy and Water Consumption and Pollutions Profile.

Don't forget to Follow us on LinkedIn and Facebook to get the latest about our new blog posts, projects, and publications. Also see below our related publications and tools.

Textile infograph.jpg

Some of our related publications and tools are:

1.     Hasanbeigi, Ali; Price, Lynn; (2015). A Technical Review of Emerging Technologies for Energy and Water Efficiency and Pollution Reduction in the Textile Industry. Journal of Cleaner Production. 

2.   Hasanbeigi, Ali (2013). Emerging Technologies for an Energy-Efficient, Water-Efficient, and Low-Pollution Textile Industry. Berkeley, CA: Lawrence Berkeley National Laboratory. LBNL-6510E

3.     Hasanbeigi, Ali; Hasanabadi, Abdollah; Abdolrazaghi, Mohamad, (2012). Energy Intensity Analysis for Five Major Sub-Sectors of the Textile Industry. Journal of Cleaner Production 23 (2012) 186-194

4.     Hasanbeigi, Ali; Price, Lynn (2012). A Review of Energy Use and Energy Efficiency Technologies for the Textile Industry. Renewable and Sustainable Energy Reviews 16 (2012) 3648– 3665.

5.    Also, you can check out the Energy Efficiency Assessment and Greenhouse Gas Emission Reduction Tool for the Textile Industry (EAGER Textile), which I developed a few years ago while still working at LBNL. EAGER Textile tool allows users to conduct a simple techno-economic analysis to evaluate the impact of selected energy efficiency measures in a textile plant by choosing the measures that they would likely introduce in a facility, or would like to evaluate for potential use.


Hurricanes Maria, Irma, Harvey: How to Keep out the Flood Water by Pumping Less

storm-407963_1280.jpg

First, I should say that my heart goes to all people who are affected by Hurricane Maria, Hurricane Irma, and Hurricane Harvey in Texas, Louisiana, Florida, Puerto Rico, and all islands in the Caribbean. At times like this, we shall all come together to help the people in need.


Whether or not we like it or believe in it, climate change is causing global warming. That in term is causing an increase in severe weather and natural disasters. We are all witnessing the worst in a century hurricanes, tropical storms, flooding, and droughts all over the world. This is not a coincident. Scientists have been yelling and warning us about this for years now. It’s time to listen and act before it is too late. According to NASA, storms feed off of latent heat, which is why scientists think global warming is strengthening storms. Extra heat in the atmosphere or ocean nourishes storms. While we cannot pin point the extend of effect by climate change on recent strong hurricanes, it is certainly one of the key factors knowing that, according to UN’s Intergovernmental Panel on Climate Change, “Scientific evidence for warming of the climate system is unequivocal.”

GlobalTemp.png

When hurricane Harvey hit Houston, the fourth most populous city in the US, large areas of the city got flooded. Same thing happened in many cities in Florida and Caribbean Islands when hurricane Irma and Maria devastated cities there. I saw on TV that people were using pumps is some areas to drain the water from their property and streets. Apparently, it is a common practice in Miami even after a heavy rain.

We all believe that “prevention is better than cure.” The same thing is true with global warming and climate change and preventing the consequences of them including hurricanes and flooding. In general, by improving energy efficiency, we can reduce burning fossil fuels and thereby reduce greenhouse gasses (GHG) emissions which cause global warming and climate change. In this article, as an example, I focus on pumps and pumping systems and how their impact on climate change can be reduced.

In a series of reports we recently published on Energy Efficiency and GHG Emissions Reduction Potential in Industrial Motor Systems in the U.S. covering 30 U.S. States (Available from this Link), we estimated the energy use by industrial pump systems in 30 different states in the U.S., separately. Our analysis shows that industrial pump systems in Florida, Texas, and Louisiana, which were flooded by recent hurricanes, together consumed over 37,000 GWh of electricity in 2015. That is about the electricity use by 3.5 million U.S. households. Industrial pump systems in the entire U.S. consumed over 147,000 GWh in 2015, which accounts for about 20% of total electricity use in the U.S. manufacturing in that year. In other words, the electricity use by industrial pump systems in the U.S. is equal to electricity use by 13.5 million U.S. households. In terms of GHG emissions, industrial pump systems alone are responsible for over 163 Billion lb of carbon dioxide (CO2) emissions per year in the U.S.

In the same reports, we quantified energy saving and GHG emissions reduction potentials and cost-effectiveness of energy efficiency measures for industrial pump systems in each state studied including Florida, Texas, and Louisiana. Our analyses shows that up to 35% of the electricity use in the industrial pump systems can be saved by implementing commercially available energy efficiency and system optimization measures and technologies. Most importantly, over half of this energy saving potential is cost-effective. This means that to save a kWh of electricity will cost less than the average unit prices of electricity for industry in each of the 30 states studied. In other words, investing in energy efficiency in pump systems will result in millions of dollars in savings for companies, utilities, and tax payers. This will also result in creation of thousands of jobs for local communities in each state. In addition, the electricity savings will subsequently result in reduction in GHG emissions and other air pollutions from power plants. The combined GHG reduction potential from energy efficiency in industrial pump systems in Florida, Texas, and Louisiana is over 11 Billion lb of CO2 emissions per year.

These efficiency improvements will have absolutely no negative impact on production or services served by the pump systems. These are just commercially available system optimization measures which will result in both energy and cost savings as well as GHG emissions reduction.

Above, I just gave you an example of industrial pump systems. If you add other motor systems such as fan systems, compressor systems, etc. and also motor systems in other sectors (buildings, power sector, agriculture sector, etc.), the absolute energy saving, cost savings, and GHG emissions reductions will be up to 5 times higher than what was mentioned above for the industrial pump systems.

In addition to the industrial pump systems reports mentioned above, we have also published separate reports to quantify energy use, energy saving, and GHG emissions reduction potentials and cost-effectiveness of efficiency technologies and measures in industrial fan systems and industrial compressed air systems in 30 different states in the U.S. 

See Reports: U.S. Industrial Motor Systems Energy Efficiency Reports Covering 30 States >>

Don't forget to Follow us on LinkedIn and Facebook to get the latest about our new blog posts, projects, and publications.


Available Now: Reports on Electricity Saving Potentials in U.S. Industrial Motor Systems

demand response.jpg

In the U.S., industrial electric motor systems account for over 70% of manufacturing electricity consumption. Motors are used to drive pumps, fans, compressed air systems, material handling, processing systems and more. Industrial motor systems represent a largely untapped cost-effective source for industrial energy efficiency savings that could be realized with existing commercialized technologies. A major barrier to effective policy making for government and utilities in the U.S. related to energy efficiency improvement in industrial motor systems is the lack of information and data on the magnitude and cost-effectiveness of these energy savings potential in each state in the U.S. and a comprehensive strategy and roadmap.

Global Efficiency Intelligence, LLC has been working on an initiative to study and analyze the industrial motor systems in different states in the United States. We have 30 States from different regions in the U.S. that are included in this initiative. All top 20 U.S. states in terms of industrial energy consumption are included in this initiative. We work with various public and private stakeholders on this project. This initiative focuses on industrial pumps, fans, and compressed air systems which together account for over 80% of electricity use in industrial motor systems in the U.S. We conduct various analyses at the state-level such as analyzing the energy use by each motor system type and system size at manufacturing subsector level (e.g. chemical, food, textile, steel, machinery, pulp and paper, etc.), analyzing energy saving potentials and cost by technology and system size for each state, analyzing barriers and drivers to energy efficiency and system optimization in industrial motor systems in each state, and analyzing policy making and market implications for each state.

Don't forget to Follow us on LinkedIn and Facebook to get the latest about our new blog posts, projects, and publications.

Quantifying The Embodied Carbon Of Traded Goods

Author: Ali Hasanbeigi, Ph.D.

Globalization has resulted in substantial increase in global trade of goods and services across countries around the world. Often, goods are produced in developing countries where labor cost is lower, and developed countries are often net importers.

tablet-1737896_1920.jpg

The UNFCCC’s greenhouse gas (GHG) accounting system works on the basis of national production rather than consumption of emissions. This means that when goods are traded, their embodied emissions (e.g. emissions associated with manufacture) are also traded. However, these imported emissions are not counted towards a country’s reported climate impacts. It is estimated that around 22% of global CO2 emissions comprise goods and services which have been internationally traded. Better understanding and providing solutions to address the embodied carbon of traded goods will be critical in global and national efforts to decarbonize industry. In addition, large and multinational companies are paying more attention to the energy and carbon footprint of their supply chain. Also, with higher consumer awareness, end users of products are also paying increasing attention to energy and carbon footprint of the goods they use.

Global Efficiency Intelligence, LLC. has partnered with the ClimateWorks Foundation and KGM & Associate Ltd. to use the most recent available data and a cutting-edge model to conduct a global assessment of the extent of the embodied carbon in globally traded goods, so-called carbon loophole. In addition, we will conduct a series of higher-resolution, deeper dive case studies into a few key sectors and geographies of most importance.

The report of this study is expected to be published in the spring of 2018.

Don't forget to Follow us on LinkedIn and Facebook to get the latest about our new blog posts, projects, and publications.

Global Efficiency Intelligence and Rocky Mountain Institute are Assisting Chinese Cities To Peak Their GHG Emissions

HK small.jpg

In September 2015 at the first U.S.-China Climate-Smart/Low-Carbon Cities Summit, China’s Alliance of Pioneer Peaking Cities (APPC) announced that 23 cities and provinces are now members and committed to peaking emissions by or before 2030. In addition, these cities committed to report on greenhouse gas (GHG) inventories, establish climate action plans, and enhance bilateral and multilateral partnership and cooperation. These cities and provinces represent about 16.8 percent of China’s population, 27.5 percent of national GDP, and 15.6 percent of national carbon dioxide emissions. By 2050, over 80% of Chinese population will be living in cities.

With industry sector accounting for over 65% of primary energy use and about 70% of total GHG emissions in China, it is quite common to find manufacturing plants (including heavy industries) within the boundary of many cities in China. Therefore, peaking GHG emissions in Chinese cities will not be possible without addressing the energy use and GHG emissions in industries located in those cities.

One of the APPC cities is Wuhan, the capital of Hubei province. Wuhan committed to achieve the peaking of GHG emissions by 2022. Global Efficiency Intelligence (GEI) has joined Rocky Mountain Institute (RMI) in their effort to help the city of Wuhan to peak its industrial GHG emissions by 2022. In this project, RMI and GEI are working with local partners to conduct both technical and policy analysis in order to come up with a concrete action plan and practical suggestions for the city of Wuhan to achieve its emission peaking goal. The aim is to develop methodologies and tools that can be replicated across other cities in China to help them with their GHG emissions peaking targets. 

Don't forget to Follow us on LinkedIn and Facebook to get the latest about our new blog posts, projects, and publications.


The Impact of Emissions Control Technologies on Emissions from the Cement and Steel Industry in China up to 2050

smoke-258786_1280.jpg

Production of iron and steel is an energy-intensive and air polluting manufacturing process. In 2014, the iron and steel industry accounted for around 28 percent of primary energy consumption of Chinese manufacturing (NBS 2015a). Steel production in 2015 was 804 Mt (worldsteel, 2016), representing 49.5% of the world production that year (Figure 1).

Figure 1. China’s Crude Steel Production and Share of Global Production (1990-2015) (EBCISIY, various years; NBS, 2015b, worldsteel 2016)

Figure 1. China’s Crude Steel Production and Share of Global Production (1990-2015) (EBCISIY, various years; NBS, 2015b, worldsteel 2016)

Chinese steel industry contributed to about 20% of SO2 emissions, and 27% of dust and PM emissions for all key manufacturing industry in China in 2013 (Wang et al. 2016).

China also produces over half of the world’s cement with 2,360 million Mt produced in China in 2015 (NBS 2015b). Two types of kilns are used in China to produce clinker, which is the key ingredient in cement: vertical shaft kilns and rotary kilns. Vertical shaft kilns are outdated technologies that use significantly more energy to produce a ton of clinker than rotary kilns do. The cement production from rotary kilns grew rapidly in recent years, from 116 Mt in 2000 to 1,494 Mt in 2010 (Figure 2).

Note: 2011 – 2015 production shares are based on our model projectionsFigure 2. Cement production in China by kiln type, 1990-2015 (ITIBMIC 2004, MIIT 2011, NBS 2015b)

Note: 2011 – 2015 production shares are based on our model projections

Figure 2. Cement production in China by kiln type, 1990-2015 (ITIBMIC 2004, MIIT 2011, NBS 2015b)

Consistent with the Chinese cement industry’s large production volume, total CO2 emissions from the industry are very high, as are associated air pollutant emissions, including sulfur dioxide (SO2), nitrogen oxides (NOX), carbon monoxide (CO), and particulate matter (PM). These emissions cause significant regional and global environmental problems. The cement industry is the largest source of PM emissions in China, accounting for 40 percent of PM emissions from all industrial sources and 27 percent of total national PM emissions (Lei et al. 2011).


In addition to setting emissions standard and adoption of end-of-pipe emissions control technologies, Chinese government policies also focus on reducing energy use, which, in turn, helps to reduce greenhouse gas (GHG) emissions. Other important co-benefits of energy-efficiency policies and programs are reduced harm to human health through reduction in air pollutant emissions, reduced corrosion, and reduction in crop losses caused by surface ozone and regional haze.

In early 2017, my colleagues at Lawrence Berkeley National Laboratory and I published a study in which we analyzed and projected the total particulate matter (PM) and sulfur dioxide (SO2) emissions from the Chinese cement and steel industry during 2010-2050 under three different scenarios. We used the bottom-up emissions control technologies data to make the emissions projections. The three distinct scenarios developed were as follow:

  1. Base Case Scenario: a baseline scenario that assumes that only policies in place in 2010 continue to have effect, and autonomous technological improvement (including efficiency improvement and fuel switching) occurs. The end-of-pipe emissions control technologies shares and penetration remain at 2010 level through the study period up to 2050.

  2. Advanced scenario: China meets its energy needs and improves its energy security and environmental quality by deploying the maximum feasible share of currently cost-effective energy efficiency and renewable supply technologies by 2050. The end-of-pipe emissions control technologies share and penetration remain at 2010 level through the study period up to 2050.

  3. Advanced scenario with Improved End-of-Pipe (EOP) Emissions Control (Advanced EOP): Similar to Advanced scenario explained above with the only difference being the end-of-pipe emissions control technologies share and penetration rate improves through the study period up to 2050.

In all three scenarios, only technologies that are commercialized or piloted at scale are considered. Following figures show the result of our analyses.

Figure 3. Total PM emissions of Chinese cement industry under different scenarios during 2010-2050

Figure 3. Total PM emissions of Chinese cement industry under different scenarios during 2010-2050

Figure 4. Total SO2 emissions of Chinese cement industry under different scenarios during 2010-2050

Figure 4. Total SO2 emissions of Chinese cement industry under different scenarios during 2010-2050

Figure 5. Total PM emissions of Chinese steel industry under different scenarios during 2010-2050

Figure 5. Total PM emissions of Chinese steel industry under different scenarios during 2010-2050

Figure 6. Total SO2 emissions of Chinese steel industry under different scenarios during 2010-2050

Figure 6. Total SO2 emissions of Chinese steel industry under different scenarios during 2010-2050

More details of the methodology used and results can be found in our report which is published on LBNL’s website and can be downloaded from this Link. Please feel free to contact me if you have any question.

Don't forget to Follow us on LinkedIn and Facebook to get the latest about our new blog posts, projects, and publications.

Some of our related publications are:

  1. Hasanbeigi, Ali; Arens, Marlene; Rojas-Cardenas, Jose; Price, Lynn; Triolo, Ryan. (2016). Comparison of Carbon Dioxide Emissions Intensity of Steel Industry in China, Germany, Mexico, and the United States. Resources, Conservation and Recycling. Volume 113, October 2016, Pages 127–139

  2. Zhang, Qi; Hasanbeigi, Ali; Price, Lynn; Lu, Hongyou; Arens, Marlen (2016). A Bottom-up Energy Efficiency Improvement Roadmap for China’s Iron and Steel Industry up to 2050. Berkeley, CA: Lawrence Berkeley National Laboratory. LBNL- 1006356

  3. Hasanbeigi, Ali; Morrow, William; Sathaye, Jayant; Masanet, Eric; Xu, Tengfang. (2013). A Bottom-Up Model to Estimate the Energy Efficiency Improvement and CO2 Emission Reduction Potentials in the Chinese Iron and Steel Industry. Energy, Volume 50, 1 February 2013, Pages 315-325

  4. Hasanbeigi, Ali; Arens, Marlene; Price, Lynn; (2013). Emerging Energy Efficiency and CO2 Emissions Reduction Technologies for the Iron and Steel Industry. Berkeley, CA: Lawrence Berkeley National Laboratory BNL-6106E.

  5. Hasanbeigi, Ali; Agnes Lobscheid; Yue Dai; Price, Hongyou, Lynn; Lu (2012). Quantifying the Co-benefits of Energy-Efficiency Programs: A Case-study for the Cement Industry in Shandong Province, China Berkeley, CA: Lawrence Berkeley National Laboratory. LBNL-5949E.

  6. Hasanbeigi, Ali; Morrow, William; Masanet, Eric; Sathaye, Jayant; Xu, Tengfang. (2012). Assessment of Energy Efficiency Improvement and CO2 Emission Reduction Potentials in the Cement Industry in China. Berkeley, CA: Lawrence Berkeley National Laboratory. LBNL-5536E

  7. Hasanbeigi, Ali; Price, Lynn; Lin, Elina. (2012). Emerging Energy Efficiency and CO2 Emissions Reduction Technologies for Cement and ConcreteProduction. Berkeley, CA: Lawrence Berkeley National Laboratory LBNL-5434E.

  8. Hasanbeigi, Ali; Price, Lynn; Hongyou, Lu; Lan, Wang (2009). Analysis of Energy-Efficiency Opportunities for the Cement Industry in Shandong Province, China. Energy 35 (2010) 3461-3473


References

  • Hasanbeigi, Ali; Nina Khanna, Price, Lynn (2017). Air Pollutant Emissions Projection for the Cement and Steel Industry in China and the Impact of Emissions Control Technologies. Berkeley, CA: Lawrence Berkeley National Laboratory.

  • Editorial Board of China Iron and Steel Industry Yearbook (EBCISIY). Various years. China Iron and Steel Industry Yearbook. Beijing, China (in Chinese).

  • Institute of Technical Information for Building Materials Industry (ITIBMIC). 2004. “Final Report on Cement Survey.” Prepared for the United Nations Industrial Development Organization (UNIDO) for the Contract Entitled Cement Sub-sector Survey for the Project Energy Conservation and GHG Emissions Reduction in Chinese TVEs-Phase II.

  • Lei,Y., Q. Zhang, C. Nielsen, K. He. 2011. “An inventory of primary air pollutants and CO2 emissions from cement production in China, 1990-2020.” Atmospheric Environment 45:147-154.

  • Ministry of Industry and Information Technology (MIIT). 2011. Production of building materials industry in 2010 and rapid growth of output of major products.

  • NBS. 2015a. China Energy Statistics Yearbook 2015. Beijing: China Statistics Press.

  • NBS. 2015b. China Statistical Yearbook 2015. Beijing: China Statistics Press.

  • Wang, K., Tian, H., Hua, S., Zhu, C., Gao, J., Xue, Y., Hao, J., Wang, Y., Zhou, J. 2016. A comprehensive emissions inventory ofmultiple air pollutants from iron and steel industry in China: Temporal trends and spatial variation characteristics. Science of the Total Environment 559 (2016) 7–14.

  • World Steel Association (worldsteel). 2016. Steel Statistical Yearbook 2016.


Infographic: The Iron and Steel Industry’s Energy Use and Emissions

steel-mill-616526_1280.jpg

The iron and steel industry is one of the most energy-intensive and highest CO2 emitting industries and one of the key industrial contributors to air pollutions (PM, SO­2, etc.) in the world. The infographic below is prepared by Global Efficiency Intelligence, LLC to summarize some key information on energy use and emissions in the iron and steel industry.

Global Efficiency Intelligence, LLC has experience conducting various projects and studies on energy efficiency, GHG and other emissions reduction, energy benchmarking, and technology roadmapping for the iron and steel industry in China, India, U.S., Germany, and Mexico.

Don't forget to Follow us on LinkedIn and Facebook to get the latest about our new blog posts, projects, and publications.

Some of our related publications are:

  • Hasanbeigi, Ali; Arens, Marlene; Rojas-Cardenas, Jose; Price, Lynn; Triolo, Ryan. (2016). Comparison of Carbon Dioxide Emissions Intensity of Steel Industry in China, Germany, Mexico, and the United States. Resources, Conservation and Recycling. Volume 113, October 2016, Pages 127–139

  • Zhang, Qi; Hasanbeigi, Ali; Price, Lynn; Lu, Hongyou; Arens, Marlen (2016). A Bottom-up Energy Efficiency Improvement Roadmap for China’s Iron and Steel Industry up to 2050. Berkeley, CA: Lawrence Berkeley National Laboratory. LBNL- 1006356

  • Morrow, William; Hasanbeigi, Ali; Sathaye, Jayant; Xu, Tengfang. 2014. Assessment of Energy Efficiency Improvement and CO2 Emission Reduction Potentials in India’s Cement and Iron & Steel Industries. Journal of Cleaner Production. Volume 65, 15 February 2014, Pages 131–141

  • Hasanbeigi, Ali; Price, Lynn, Aden, Nathaniel; Zhang Chunxia; Li Xiuping; Shangguan Fangqin. 2014. Comparison of Iron and Steel Production Energy Use and Energy Intensity in China and the U.S. Journal of Cleaner Production, Volume 65, 15 February 2014, Pages 108–119

  • Hasanbeigi, Ali; Arens, Marlene; Price, Lynn; (2013). Emerging Energy Efficiency and CO2 Emissions Reduction Technologies for the Iron and Steel Industry. Berkeley, CA: Lawrence Berkeley National Laboratory BNL-6106E.

  • Hasanbeigi, Ali; Morrow, William; Sathaye, Jayant; Masanet, Eric; Xu, Tengfang. (2013). A Bottom-Up Model to Estimate the Energy Efficiency Improvement and CO2 Emission Reduction Potentials in the Chinese Iron and Steel Industry. Energy, Volume 50, 1 February 2013, Pages 315-325

  • Hasanbeigi, A., Price, L., Aden, N., Zhang C., Li X., Shangguan F. 2011. A Comparison of Iron and Steel Production Energy Use and Energy Intensity in China and the U.S. Berkeley CA: Lawrence Berkeley National Laboratory Report LBNL-4836E.


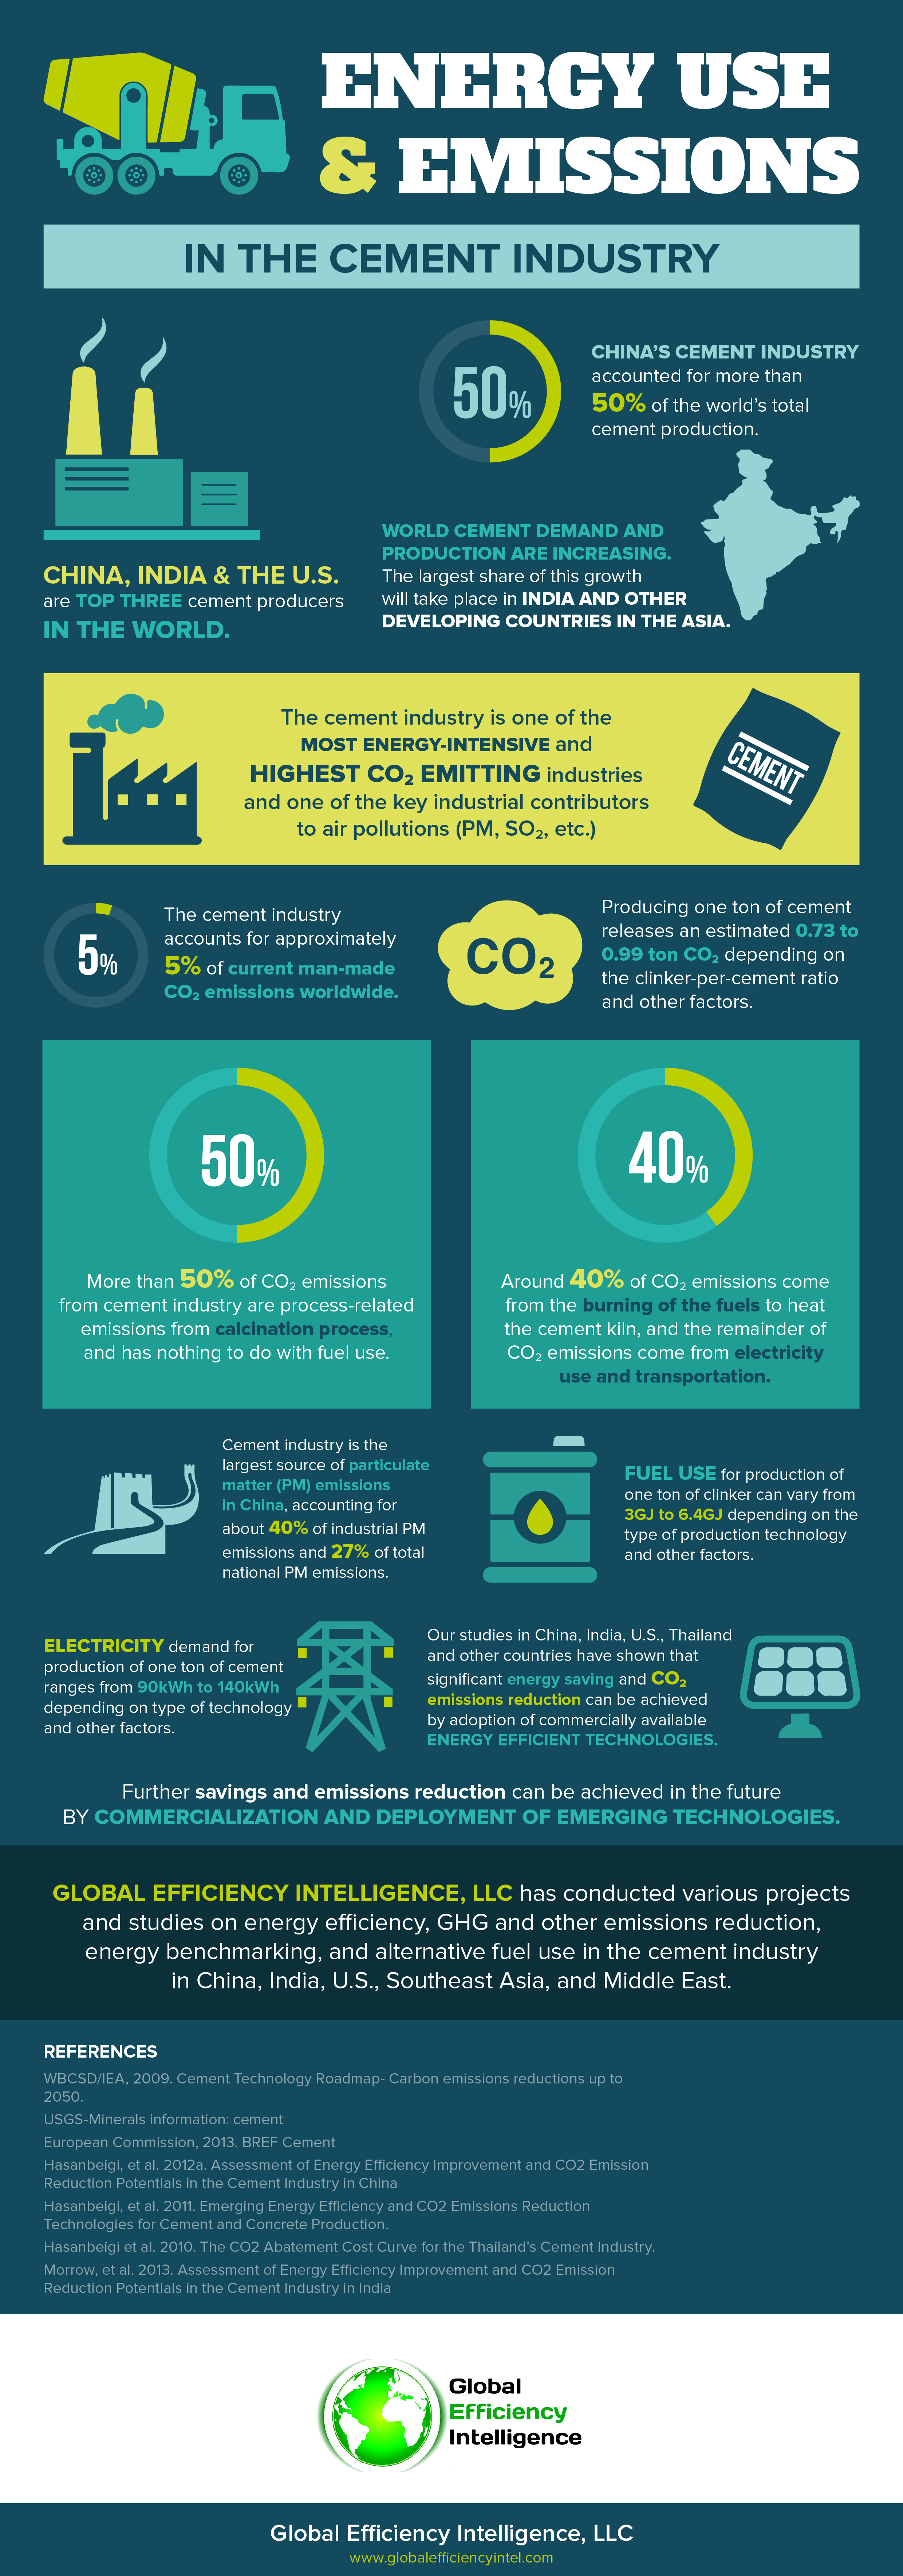
Infographic: Energy Use and Emissions in the Cement Industry

The cement industry is one of the most energy-intensive and highest CO2 emitting industries and one of the key industrial contributors to air pollutions (PM, SO­2, etc.) in the world. The inforgraphic below is prepared by Global Efficiency Intelligence, LLC to summarize some key information on energy use and emissions in the cement industry.

Global Efficiency Intelligence, LLC has experience conducting various projects and studies on energy efficiency, GHG and other emissions reduction, energy benchmarking, and alternative fuel use in the cement industry in China, India, U.S., Southeast Asia, and the Middle East.

Don't forget to Follow us on LinkedIn and Facebook to get the latest about our new blog posts, projects, and publications.


Some of our related publications are:

  • Hasanbeigi, Ali; Nina Khanna, Price, Lynn (2017). Air Pollutant Emissions Projection for the Cement and Steel Industry in China and the Impact of Emissions Control Technologies. Berkeley, CA: Lawrence Berkeley National Laboratory. 1007268

  • Hasanbeigi, Ali; Agnes Lobscheid; Hongyou, Lu; Price, Lynn; Yue Dai (2013). Quantifying the Co-benefits of Energy-Efficiency Programs: A Case-study for the Cement Industry in Shandong Province, China. Science of the Total Environment. Volumes 458–460, 1 August 2013, Pages 624-636.

  • Hasanbeigi, Ali; Morrow, William; Masanet, Eric; Sathaye, Jayant; Xu, Tengfang. 2013. Energy Efficiency Improvement Opportunities in the Cement Industry in China. Energy Policy Volume 57, June 2013, Pages 287–297

  • Hasanbeigi, Ali; Price, Lynn; Lin, Elina. (2012). Emerging Energy Efficiency and CO2 Emissions Reduction Technologies for Cement and Concrete  Production. Berkeley, CA: Lawrence Berkeley National Laboratory LBNL-5434E.

  • Morrow, William; Hasanbeigi, Ali; Sathaye, Jayant; Xu, Tengfang. 2014. Assessment of Energy Efficiency Improvement and CO2 Emission Reduction Potentials in India’s Cement and Iron & Steel Industries. Journal of Cleaner Production. Volume 65, 15 February 2014, Pages 131–141

  • Hasanbeigi, Ali; Menke, Christoph; Therdyothin, Apichit (2010). Technical and Cost Assessment of Energy Efficiency Improvement and Greenhouse Gas Emissions Reduction Potentials in Thai Cement Industry. Energy Efficiency. DOI 10.1007/s12053-010-9079-1

  • Hasanbeigi, Ali; Menke, Christoph; Therdyothin, Apichit (2010). The Use of Conservation Supply Curves in Energy Policy and Economic Analysis: the Case Study of Thai Cement Industry. Energy Policy 38 (2010) 392–405

  • Hasanbeigi, Ali; Price, Lynn; Hongyou, Lu; Lan, Wang (2010). Analysis of Energy-Efficiency Opportunities for the Cement Industry in Shandong Province, China: A Case-Study of Sixteen Cement Plants. Energy-the International Journal 35 (2010) 3461-3473.


36 Emerging Technologies for Energy-efficiency and GHG Emissions Reduction in the Pulp and Paper Industry

The pulp and paper industry accounted for approximately 5 percent of total industrial final energy consumption and 2 percent of direct carbon dioxide (CO2) emissions from the industrial sector worldwide (IEA 2011). (Note: Direct CO2 emissions are emissions from fossil fuel use and chemical reactions produced onsite and do not include emissions associated with purchased steam and electricity.) World paper and paperboard demand and production are increasing; annual production is expected to grow from approximately 365 million tonnes (Mt) in 2006 to between 700 Mt (low estimate) and 900 Mt (high estimate) in 2050. The largest share of this growth will take place in China, India, and other developing countries (see Figure below). This significant increase in paper production will cause a corresponding significant increase in the pulp and paper industry’s absolute energy consumption and greenhouse gas (GHG) emissions.

Note: OECD is an acronym for the Organization for Economic Co-operation and DevelopmentFigure 1. Annual world paper and paperboard production (IEA 2009)

Note: OECD is an acronym for the Organization for Economic Co-operation and Development

Figure 1. Annual world paper and paperboard production (IEA 2009)

Studies have documented the potential to save energy by implementing commercially-available energy-efficiency technologies and measures in the pulp and paper industry worldwide. However, today, given the projected continuing increase in absolute paper production, future reductions (e.g., by 2030 or 2050) in absolute energy use and CO2 emissions will require further innovation in this industry. Innovations will likely include development of different processes and materials for paper production or technologies that can economically capture and store the industry’s CO2 emissions. The development of these emerging technologies and their deployment in the market will be a key factor in the pulp and paper industry’s mid- and long-term climate change mitigation strategies.

Many studies from around the world have identified sector-specific and cross- energy-efficiency technologies for the pulp and paper industry that have already been commercialized (See figure below). However, information is scarce and scattered regarding emerging or advanced energy-efficiency and low-carbon technologies for the pulp and paper industry that have not yet been commercialized.

Figure: Commercialized energy efficiency technologies and measures for pulp and paper industry (Source: IIP, 2012)

Figure: Commercialized energy efficiency technologies and measures for pulp and paper industry (Source: IIP, 2012)

My colleagues at Lawrence Berkeley National Laboratory and I wrote a report that consolidated available information on emerging technologies for the pulp and paper industry with the goal of giving engineers, researchers, investors, paper companies, policy makers, and other interested parties easy access to a well-structured database of information on this topic.

The information about the 36 emerging technologies for the pulp and paper industry was covered in the report and was presented using a standard structure for each technology. Table below shows the list of the technologies covered.

Table. Emerging energy-efficiency and CO2 emissions-reduction technologies for the pulp and paper industry (Kong and Hasanbeigi, et al. 2013 and 2015)

Shifting away from conventional processes and products will require a number of developments including: education of producers and consumers; new standards; aggressive research and development to address the issues and barriers confronting emerging technologies; government support and funding for development and deployment of emerging technologies; rules to address the intellectual property issues related to dissemination of new technologies; and financial incentives (e.g. through carbon trading mechanisms) to make emerging low-carbon technologies, which might have a higher initial costs, competitive with the conventional processes and products.

Our report is published on LBNL’s website and can be downloaded from this Link. Please feel free to contact me if you have any question.

Don't forget to Follow us on LinkedIn and Facebook to get the latest about our new blog posts, projects, and publications.

Some of our related publications are:

  1. Kong, Lingbo; Hasanbeigi, Ali; Price, Lynn, Huanbin Liu (2015). Energy conservation and CO2 mitigation potentials in the Chinese pulp and paper industry. Resource Conservation and Recycling (Accepted- In Press. Available online 29 May 2015).

  2. Kong, Lingbo; Price, Lynn; Hasanbeigi, Ali; Liu, Huanbin; Li, Jigeng. (2013) Potential for Reducing Paper Mill Energy Use and Carbon Dioxide Emissions through Plant-wide Energy Audits: A Case Study in China. Applied Energy, Volume 102, February 2013, Pages 1334–1342

  3. Kong, Lingbo; Hasanbeigi, Ali; Price, Lynn, Huanbin Liu (2013). Analysis of Energy-Efficiency Opportunities for the Pulp and Paper Industry in China. Berkeley, CA: Lawrence Berkeley National Laboratory. LBNL-6107E

References:

  • Kong, Lingbo; Hasanbeigi, Ali; Price, Lynn (2015). Assessment of emerging energy-efficiency technologies for the pulp and paper industry: A technical review. Journal of Cleaner Production. Volume 122, 20 May 2016, Pages 5–28

  • Kong, Lingbo; Hasanbeigi, Ali; Price, Lynn (2013). Emerging Energy Efficiency and Greenhouse Gas Mitigation Technologies for the Pulp and Paper Industry. Berkeley, CA: Lawrence Berkeley National Laboratory. LBNL-5956E.

  • Institute for Industrial Productivity, 2012. Pulp and paper energy efficiency technologies.

  • International Energy Agency (IEA). 2011. Energy Transition for Industry: India and the Global Context. Paris, France.

  • International Energy Agency (IEA). 2009. Energy Technology Transitions for Industry - Strategies for the Next Industrial Revolution. Paris, France.


Infographic: The Profile of Energy Use in Industrial Motor Systems

According to International Energy Agency, around half of the electricity used globally is consumed in electric motor systems. Industrial motor systems account for around 70% of manufacturing electricity consumption in different countries. The inforgraphic below is prepared by Global Efficiency Intelligence, LLC to summarize some key information on energy use in motor systems worldwide.

Global Efficiency Intelligence, LLC is working on Global Motor Systems Efficiency Initiative and the U.S. Motor Systems Efficiency Initiative (covers 30 states in the U.S.) to analyze the energy use in industrial motor systems and energy efficiency potentials in these systems at manufacturing subsectors level in different countries or states in the U.S. For more information, click on the links above to see our projects page.

Available Now: U.S. Industrial Motor Systems Energy Efficiency Reports >>

Don't forget to Follow us on LinkedIn and Facebook to get the latest about our new blog posts, projects, and publications.

18 Emerging Technologies and 180 Commercialized Technologies and Measures for Energy and Water Efficiency, and GHG Emissions Reduction in the Textile Industry

The textile industry uses large amounts of electricity, fuel, and water, with corresponding greenhouse gas emissions (GHGs) and contaminated effluent.  With regard to energy use, the textile industry’s share of fuel and electricity use within the total final energy use of any one country depends on the structure of the textile industry in that country. For instance, electricity is the dominant energy source for yarn spinning whereas fuels are the major energy source for textile wet processing.

In addition to using substantial energy, textile manufacturing uses a large amount of water, particularly for wet processing of materials, and produces a significant volume of contaminated effluent. Conserving water and mitigating water pollution will also be part of the industry’s strategy to make its production processes more environmentally friendly, particularly in parts of the world where water is scarce.

In 2016, the world’s population was 7.4 billion; this number is expected to grow to 9.5 billion by 2050. The bulk of this growth will take place in underdeveloped and developing countries. As the economy in these countries improves, residents will have more purchasing power; as a result, per-capita consumption of goods, including textiles, will increase. In short, future population and economic growth will stimulate rapid increases in textile production and consumption, which, in turn, will drive significant increases in the textile industry’s absolute energy use, water use, and carbon dioxide (CO2) and other environmentally harmful emissions.

Having the higher education background in both textile technology engineering and energy efficiency technologies, I wrote a report on commercially available energy-efficiency technologies and measures for the textile industry several years ago. This report included a review of over 180 commercialized energy efficiency technologies and measures for the textile industry based on case-studies around the world. In addition to conserving energy, some of the technologies and measures presented also conserve water. The report can be downloaded from this Link (Hasanbeigi 2010).

Several other reports also document the application of commercialized technologies. However, today, given the projected continuing increase in absolute textile production, future reductions (e.g., by 2030 or 2050) in absolute energy use and CO2 emissions will require further innovation in this industry. Innovations will likely include development of different processes and materials for textile production or technologies that can economically capture and store the industry’s CO2 emissions. The development of these emerging technologies and their deployment in the market will be a key factor in the textile industry’s mid- and long-term climate change mitigation strategies.

However, information is scarce and scattered regarding emerging or advanced energy-efficiency and low-carbon technologies for the textile industry that have not yet been commercialized. That was why a few years ago, I wrote another report that consolidated available information on 18 emerging technologies for the textile industry with the goal of giving engineers, researchers, investors, textile companies, policy makers, and other interested parties easy access to a well-structured database of information on this topic. Table below shows the list of the technologies covered.

Table. Emerging energy-efficiency, water efficiency, and GHG emissions reduction technologies for the textile industry (Hasanbeigi 2015)

A few years ago when I conducted several day-long training on energy efficiency in the textile industry for hundreds of engineers and manager of textile companies in China, one major feedback we received, which did not surprise me, was that they did not know about most of the commercialized and emerging technologies we introduced. Engineers and manager are busy with day-to-day routine which rarely involves energy efficiency improvement.  

Also, you can check out the Energy Efficiency Assessment and Greenhouse Gas Emission Reduction Tool for the Textile Industry (EAGER Textile), which we developed a few years ago. EAGER Textile tool allows users to conduct a simple techno-economic analysis to evaluate the impact of selected energy efficiency measures in a textile plant by choosing the measures that they would likely introduce in a facility, or would like to evaluate for potential use.

Don't forget to Follow us on LinkedIn and Facebook to get the latest about our new blog posts, projects, and publications.

Some of our related publications are:

1.     Hasanbeigi, Ali; Price, Lynn; (2015). A Technical Review of Emerging Technologies for Energy and Water Efficiency and Pollution Reduction in the Textile Industry. Journal of Cleaner Production. DOI 10.1016/j.jclepro.2015.02.079.

2.     Hasanbeigi, Ali; Hasanabadi, Abdollah; Abdolrazaghi, Mohamad, (2012). Energy Intensity Analysis for Five Major Sub-Sectors of the Textile Industry. Journal of Cleaner Production 23 (2012) 186-194

3.     Hasanbeigi, Ali; Price, Lynn (2012). A Review of Energy Use and Energy Efficiency Technologies for the Textile Industry. Renewable and Sustainable Energy Reviews 16 (2012) 3648– 3665.

References:

·      Hasanbeigi, Ali (2013). Emerging Technologies for an Energy-Efficient, Water-Efficient, and Low-Pollution Textile Industry. Berkeley, CA: Lawrence Berkeley National Laboratory. LBNL-6510E

·      Hasanbeigi, Ali, (2010). Energy Efficiency Improvement Opportunities for the Textile Industry. Berkeley, CA: Lawrence Berkeley National Laboratory. LBNL-3970E


56 Emerging Technologies for Energy-efficiency and GHG Emissions Reduction in the Iron and Steel Industry

Iron and steel manufacturing is one of the most energy-intensive industries worldwide. In addition, use of coal as the primary fuel for iron and steel production means that iron and steel production has among the highest carbon dioxide (CO2) emissions of any industry. According to the International Energy Agency, the iron and steel industry accounts for the largest share – approximately 27 percent – of CO2 emissions from the global manufacturing sector.

Figure 1: World steel production in 2015 by countries and regions (worldsteel 2016)

Figure 1: World steel production in 2015 by countries and regions (worldsteel 2016)

China accounts for around half of the world’s steel production. Annual world steel demand is expected to grow from approximately 1,410 million tonnes (Mt) of crude steel in 2010 to approximately 2,200 Mt in 2050. The bulk of this growth will take place in China, India, and other developing countries in Asia (Bellevrat and Menanteau 2008). This significant increase in steel consumption and production will drive a significant increase in the industry’s absolute energy use and CO2 emissions.

Studies have documented the potential to save energy by implementing commercially-available energy-efficiency technologies and measures in the iron and steel industry worldwide. However, today, given the projected continuing increase in absolute steel production, future reductions (e.g., by 2030 or 2050) in absolute energy use and CO2 emissions will require further innovation in this industry. Innovations will likely include development of different processes and materials for steel production or technologies that can economically capture and store the industry’s CO2 emissions. The development of these emerging technologies and their deployment in the market will be a key factor in the iron and steel industry’s mid- and long-term climate change mitigation strategies.

Many studies from around the world have identified sector-specific and cross- energy-efficiency technologies for the iron and steel industry that have already been commercialized (See figure below). However, information is scarce and scattered regarding emerging or advanced energy-efficiency and low-carbon technologies for the steel industry that have not yet been commercialized.

Figure 2: Commercialized energy efficiency technologies and measures for iron and steel industry (Source: IIP, 2012)

Figure 2: Commercialized energy efficiency technologies and measures for iron and steel industry (Source: IIP, 2012)

My colleagues at Lawrence Berkeley National Laboratory and I wrote a report that consolidated available information on emerging technologies for the iron and steel industry with the goal of giving engineers, researchers, investors, steel companies, policy makers, and other interested parties easy access to a well-structured database of information on this topic.

The information about the 56 emerging technologies for the steel industry was covered in the report and was presented using a standard structure for each technology. Table below shows the list of the technologies covered.

Table 1. Emerging energy-efficiency and CO2 emissions-reduction technologies for the iron and steel industry (Hasanbeigi et al. 2013)

Shifting away from conventional processes and products will require a number of developments including: education of producers and consumers; new standards; aggressive research and development to address the issues and barriers confronting emerging technologies; government support and funding for development and deployment of emerging technologies; rules to address the intellectual property issues related to dissemination of new technologies; and financial incentives (e.g. through carbon trading mechanisms) to make emerging low-carbon technologies, which might have a higher initial costs, competitive with the conventional processes and products.

Our report is published on LBNL’s website and can be downloaded from this Link. Please feel free to contact me if you have any question.

Don't forget to Follow us on LinkedIn and Facebook to get the latest about our new blog posts, projects, and publications.

Some of our related publications are:

  1. Hasanbeigi, Ali; Arens, Marlene; Rojas-Cardenas, Jose; Price, Lynn; Triolo, Ryan. (2016). Comparison of Carbon Dioxide Emissions Intensity of Steel Industry in China, Germany, Mexico, and the United States. Resources, Conservation and Recycling. Volume 113, October 2016, Pages 127–139

  2. Zhang, Qi; Hasanbeigi, Ali; Price, Lynn; Lu, Hongyou; Arens, Marlen (2016). A Bottom-up Energy Efficiency Improvement Roadmap for China’s Iron and Steel Industry up to 2050. Berkeley, CA: Lawrence Berkeley National Laboratory. LBNL- 1006356

  3. Morrow, William; Hasanbeigi, Ali; Sathaye, Jayant; Xu, Tengfang. 2014. Assessment of Energy Efficiency Improvement and CO2 Emission Reduction Potentials in India’s Cement and Iron & Steel Industries. Journal of Cleaner Production. Volume 65, 15 February 2014, Pages 131–141

  4. Hasanbeigi, Ali; Price, Lynn, Aden, Nathaniel; Zhang Chunxia; Li Xiuping; Shangguan Fangqin. 2014. Comparison of Iron and Steel Production Energy Use and Energy Intensity in China and the U.S. Journal of Cleaner Production, Volume 65, 15 February 2014, Pages 108–119

  5. Hasanbeigi, Ali; Morrow, William; Sathaye, Jayant; Masanet, Eric; Xu, Tengfang. (2013). A Bottom-Up Model to Estimate the Energy Efficiency Improvement and CO2 Emission Reduction Potentials in the Chinese Iron and Steel Industry. Energy, Volume 50, 1 February 2013, Pages 315-325

  6. Hasanbeigi, A., Price, L., Aden, N., Zhang C., Li X., Shangguan F. 2011. A Comparison of Iron and Steel Production Energy Use and Energy Intensity in China and the U.S. Berkeley CA: Lawrence Berkeley National Laboratory Report LBNL-4836E.

References:

  • Bellevrat, E., P. Menanteau. 2008. “Introducing carbon constraint in the steel sector: ULCOS scenarios and economic modeling.” Proceedings of the 4th Ulcos seminar, 1-2 October.

  • Hasanbeigi, Ali; Arens, Marlene; Price, Lynn; (2013). Emerging Energy Efficiency and CO2 Emissions Reduction Technologies for the Iron and Steel Industry. Berkeley, CA: Lawrence Berkeley National Laboratory BNL-6106E.

  • Institute for Industrial Productivity. 2012. Iron and Steel technologies http://ietd.iipnetwork.org/content/iron-and-steel

  • worldsteel Association. 2016. World steel in figures.