Utility

Energy Efficiency in California's Chemical Industry

petrochemical-plant-960296_1280.jpg

The chemical and petrochemical industry is the largest consumer of energy among industrial sectors in California and is one of the top GHG emissions-intensive industries as well. California's chemical industry employs over 80,000 people and its total value of shipment is around US$82 billion. In 2015, this industry emitted 6.0 million tonne of CO2 in California.

Global efficiency Intelligence, LLC has partnered with Lawrence Berkeley National Laboratory to conducted a study for California Energy Commission on energy efficiency in the Chemical industry in the state. The goal of this project is to produce a technical assessment of the chemical industry that will provide a clear understanding of R&D needs to improve the energy efficiency in the chemical industry in California and potential energy saving by adoption of current best available technologies.

Don't forget to Follow us on LinkedIn , Facebook and Twitter to get the latest about our new blog posts, projects, and publications.

Also read our related blog post:

Infographic: Chemical Industry’s Energy Use and Emissions

Infographic: Deep Electrification of Manufacturing Industries

flash-113310_1920.jpg

Over 50% of final energy demand globally is for heating. Around half of that is for heating demands in the industry sector. When talking about electrification, the focus has mostly been on the transportation and to some extend building sectors. The industry sector has often been ignored when considering deep electrification. Even if we electrify the heat demand for the entire transportation sector and building sector in the world, that only covers 30% and 25% of world’s final energy use, respectively.

The infographic below highlights some general aspects of electrification in the industry sector. There is a substantial need for more research and analysis on electrification potential in different industry subsectors and electrification technology R&D for the manufacturing sector.

Don't forget to Follow us on LinkedIn and Facebook to get the latest about our new blog posts, projects, and publications. Also, you can join our Electrification & RE in Manufacturing group on LinkedIn to get more information.

To download the high resolution image file (JPEG) of the infographic, click here.

Deep_Electrification_of_Manufacturing_Industries01.jpg

Utilities and Governments are Wasting Millions of Dollars Subsidizing A Wrong Technology for Motor Systems Efficiency

wasting-money-670x335.jpg

According to the International Energy Agency (IEA), electric motor systems consume more than half of global electricity. Industrial electric motor systems account for over 70% of total global industrial electricity usage. Electric motors operate fans; pumps; and materials-handling, compressed-air, and processing equipment.

Because motor efficiency improvements will only marginally increase the motor system’s efficiency, we must look to improve the efficiency of the equipment and systems being driven by the motor. Optimization measures such as predictive maintenance, avoiding oversized motors, and matching motor systems to specific needs, etc. could improve the energy efficiency of motor-driven systems significantly. Even more savings can be achieved by looking not only beyond the motor to the whole motor system but beyond the system to the end-use device, as shown in Figure below.

Figure. Illustration of two industrial electric motor-driven systems: (a) normal and (b) efficient (IEA 2016)

Figure. Illustration of two industrial electric motor-driven systems: (a) normal and (b) efficient (IEA 2016)

The traditional approach in most states and countries has been to focus on motors only and not on entire motor systems. As shown above, while increasing motor efficiency saves energy, optimizing the entire pump system will save much more energy. There is a need to shift the paradigm to focus on systems rather than individual motor efficiency. Programs and policies that target systems can save more energy and CO2 emissions in a more cost-effective manner than programs that focus only on motors.

Many utilities in the U.S. and governments around the world give substantial rebate for replacing electric motors with more efficient ones. While this may sound like a good thing to do, our extensive studies for 30 states in the U.S. and over 10 countries around the world shows that it is a clear waste of money. Why? Because in most cases, replacing existing motor with a more efficient one can improve the entire system efficiency by 1% - 5% (depending on the baseline efficiency of the systems). On the other hand, there are many other systems efficiency/optimization measures that can result in up to 20% - 25% efficiency improvement in the system.

pump-1758554_1920.jpg

For example, in a pump system with a Low efficiency baseline, replacing motor can only improve system efficiency by 5%, while trimming or changing impeller to match output to requirements can save about 15%, removing sediment/scale buildup from piping can save about 10% and installing variable speed drive (VSD) can save about 25% of the electricity use.

There is another very important reason why giving rebate for replacing motors with more efficient ones is such a waste of money in a massive scale. Our analysis consistently showed that replacing motor with more efficient one is by far one of the least cost-effective efficiency measures that can be implement on a motor system (for example in a pump systems or a fan systems). In other words, it cost much higher to save a kWh of electricity by replacing motor than to implement other system efficiency/optimization measures.

So, you might ask why many utilities and government prioritize giving rebate for replacing motors? The answer is it’s easier to implement and measure the saving. Utilities and government staff and program managers often need to show the amount of electricity saved as a result of implementing a rebate program. This is easier to do with equipment replacement than with soft measures such as system optimization. Having this said, many of the system optimization measures are easy to implement by in-house staff in the facilities.

To sum up, our detailed and extensive studies for three major industrial motor systems (pump systems, fan systems, and compressor systems) shows that millions of dollars spent annually by utilities and governments on rebate program for replacing electric motors with more efficient one is clearly waste of public and private funding. The better way would be to provide rebate for system efficiency measures that can save sometime up to 10 times higher energy saving with lower cost.

If utilities and governments persist to keep their motor replacement rebate program, my suggestion to them, based on the findings of our reports, is to bundle one or two efficiency measures with the motor replacement rebate. In other words, for an applicant to quality for motor replacement rebate, they should also implement one or two other system optimization measures from a list of measures that is predefined by utilities or government agencies.

To find out more about our detailed bottom-up studies for energy efficiency in industrial motor systems in the U.S., see our reports:

U.S. Industrial Motor Systems Energy Efficiency Reports Covering 30 States >>

Don't forget to Follow us on LinkedIn and Facebook to get the latest about our new blog posts, projects, and publications.

References:

IEA. 2016. World Energy Outlook 2016. Paris, France.
IEA, 2011. Energy efficiency policy opportunities for electric motor driven systems. Paris, France.


Aluminum Industry: 10 Emerging Technologies for Energy-efficiency and GHG Emissions Reduction

foil-782.jpg

Aluminum production is one of the most energy-intensive industrial processes worldwide. Although about a third of global aluminum production uses electricity from hydropower sources, the increasing use of coal as the primary fuel for electricity for aluminum production in many countries means that aluminum production is still a significant source of greenhouse gas (GHG) and greenhouse gas  emissions. According to the International Energy Agency (IEA), the aluminum industry accounts for about 1% of global GHG emissions (IEA 2012).

Annual world aluminum demand is expected to increase two- to three-fold by 2050. The bulk of growth in consumption of aluminum will take place in China, India, the Middle East, and other developing countries, where consumption is expected to nearly quadruple by 2025. To meet this increased demand, production is projected to grow from approximately 51 million tonnes (Mt) of primary aluminum in 2014 to 89-122 Mt in 2050 (IEA 2012). This increase in aluminum consumption and production will drive significant growth in the industry’s absolute energy use and GHG emissions.

Studies have documented the potential to save energy by implementing commercially-available energy-efficiency technologies and measures in the aluminum industry worldwide. However, today, given the projected continuing increase in absolute aluminum production, future reductions (e.g., by 2030 or 2050) in absolute energy use and GHG emissions will require further innovation in this industry. Innovations will likely include development of different processes and materials for aluminum production or technologies that can economically capture and store the industry’s GHG emissions. The development of these emerging technologies and their deployment in the market will be a key factor in the aluminum industry’s mid- and long-term climate change mitigation strategies.

Many studies from around the world have identified sector-specific and cross- energy-efficiency technologies for the aluminum industry that have already been commercialized. However, information is scarce and scattered regarding emerging or advanced energy-efficiency and low-carbon technologies for the aluminum industry that have not yet been commercialized.

In 2016, Cecilia Springer of Lawrence Berkeley National Laboratory and I wrote a report that consolidated available information on emerging technologies for the aluminum industry with the goal of giving engineers, researchers, investors, aluminum companies, policy makers, and other interested parties easy access to a well-structured database of information on this topic.

Information about 10 emerging technologies for the aluminum industry was covered in the report and was presented using a standard structure for each technology. Table below shows the list of the technologies covered.

Table 1. Emerging energy-efficiency and CO2 emissions-reduction technologies for the aluminum industry (Springer and Hasanbeigi, 2016)

Picture2.png

Shifting away from conventional processes and products will require a number of developments including: education of producers and consumers; new standards; aggressive research and development to address the issues and barriers confronting emerging technologies; government support and funding for development and deployment of emerging technologies; rules to address the intellectual property issues related to dissemination of new technologies; and financial incentives (e.g. through carbon trading mechanisms) to make emerging low-carbon technologies, which might have a higher initial costs, competitive with the conventional processes and products.

Our report is published on LBNL’s website and can be downloaded from this Link. Please feel free to contact me if you have any question.

Don't forget to Follow us on LinkedIn and Facebook to get the latest about our new blog posts, projects, and publications.

Some of our related publications are:

1.     Hasanbeigi, Ali (2013). Emerging Technologies for an Energy-Efficient, Water-Efficient, and Low-Pollution Textile Industry. Berkeley, CA: Lawrence Berkeley National Laboratory. LBNL-6510E

2.     Hasanbeigi, Ali; Arens, Marlene; Price, Lynn; (2013). Emerging Energy Efficiency and CO2 Emissions Reduction Technologies for the Iron and Steel Industry. Berkeley, CA: Lawrence Berkeley National Laboratory BNL-6106E.

3.     Kong, Lingbo; Hasanbeigi, Ali; Price, Lynn (2012). Emerging Energy Efficiency and Greenhouse Gas Mitigation Technologies for the Pulp and Paper Industry. Berkeley, CA: Lawrence Berkeley National Laboratory. LBNL-5956E.

4.     Hasanbeigi, Ali; Price, Lynn; Lin, Elina. (2012). Emerging Energy Efficiency and CO2 Emissions Reduction Technologies for Cement and Concrete  Production. Berkeley, CA: Lawrence Berkeley National Laboratory LBNL-5434E.

References:

Springer, Cecilia; Hasanbeigi, Ali and Price, Lynn (2016). Emerging Energy Efficiency and CO2 Emissions Reduction Technologies for the Aluminum Industry. Berkeley, CA: Lawrence Berkeley National Laboratory. LBNL-1005789

·      International Energy Agency, and Organisation de coopération et de développement économiques. 2012. Energy Technology Perspectives: Scenarios & Strategies to 2050 : In Support of the G8 Plan of Action. Paris: OECD, IEA.


Global Efficiency Intelligence and UNIDO are Helping Egypt to Improve Industrial Energy Efficiency

pyramids-2159286_1280.jpg

Egypt is the largest oil and natural gas consumer in Africa, accounting for about 20% of petroleum and other liquids consumption and around 40% of natural gas consumption in Africa. Increased industrial output, economic growth, energy-intensive natural gas and oil extraction industry, rapid population growth, rapid increase in vehicle sales, and energy subsidies are among key factors contributed to the rapid growth of energy consumption over the past few decades in Egypt.

Industry sector accounted for over 42% of natural gas, 86% of fuel oil, and 25% of total electricity consumption in Egypt in 2015. industrial electric motor systems account for over 70% of manufacturing electricity consumption.

Given its extensive experience on motor systems energy efficiency analysis, Global Efficiency Intelligence, LLC. has been working on a project for United Nations Industrial Development Organization (UNIDO) to conduct a study on electricity saving potential in industrial motor systems in Egypt. We are analyzing energy use, energy efficiency, and GHG emissions-reduction potential in industrial pump systems, fan systems, and compressed-air systems, which together account for over 70% of electricity use in industrial motor systems in Egypt. We will assess the cost-effectiveness of series of energy conservation measures that can be implemented on these motor systems in Egypt.

Don't forget to Follow us on LinkedIn and Facebook to get the latest about our new blog posts, projects, and publications.


Hurricanes Maria, Irma, Harvey: How to Keep out the Flood Water by Pumping Less

storm-407963_1280.jpg

First, I should say that my heart goes to all people who are affected by Hurricane Maria, Hurricane Irma, and Hurricane Harvey in Texas, Louisiana, Florida, Puerto Rico, and all islands in the Caribbean. At times like this, we shall all come together to help the people in need.


Whether or not we like it or believe in it, climate change is causing global warming. That in term is causing an increase in severe weather and natural disasters. We are all witnessing the worst in a century hurricanes, tropical storms, flooding, and droughts all over the world. This is not a coincident. Scientists have been yelling and warning us about this for years now. It’s time to listen and act before it is too late. According to NASA, storms feed off of latent heat, which is why scientists think global warming is strengthening storms. Extra heat in the atmosphere or ocean nourishes storms. While we cannot pin point the extend of effect by climate change on recent strong hurricanes, it is certainly one of the key factors knowing that, according to UN’s Intergovernmental Panel on Climate Change, “Scientific evidence for warming of the climate system is unequivocal.”

GlobalTemp.png

When hurricane Harvey hit Houston, the fourth most populous city in the US, large areas of the city got flooded. Same thing happened in many cities in Florida and Caribbean Islands when hurricane Irma and Maria devastated cities there. I saw on TV that people were using pumps is some areas to drain the water from their property and streets. Apparently, it is a common practice in Miami even after a heavy rain.

We all believe that “prevention is better than cure.” The same thing is true with global warming and climate change and preventing the consequences of them including hurricanes and flooding. In general, by improving energy efficiency, we can reduce burning fossil fuels and thereby reduce greenhouse gasses (GHG) emissions which cause global warming and climate change. In this article, as an example, I focus on pumps and pumping systems and how their impact on climate change can be reduced.

In a series of reports we recently published on Energy Efficiency and GHG Emissions Reduction Potential in Industrial Motor Systems in the U.S. covering 30 U.S. States (Available from this Link), we estimated the energy use by industrial pump systems in 30 different states in the U.S., separately. Our analysis shows that industrial pump systems in Florida, Texas, and Louisiana, which were flooded by recent hurricanes, together consumed over 37,000 GWh of electricity in 2015. That is about the electricity use by 3.5 million U.S. households. Industrial pump systems in the entire U.S. consumed over 147,000 GWh in 2015, which accounts for about 20% of total electricity use in the U.S. manufacturing in that year. In other words, the electricity use by industrial pump systems in the U.S. is equal to electricity use by 13.5 million U.S. households. In terms of GHG emissions, industrial pump systems alone are responsible for over 163 Billion lb of carbon dioxide (CO2) emissions per year in the U.S.

In the same reports, we quantified energy saving and GHG emissions reduction potentials and cost-effectiveness of energy efficiency measures for industrial pump systems in each state studied including Florida, Texas, and Louisiana. Our analyses shows that up to 35% of the electricity use in the industrial pump systems can be saved by implementing commercially available energy efficiency and system optimization measures and technologies. Most importantly, over half of this energy saving potential is cost-effective. This means that to save a kWh of electricity will cost less than the average unit prices of electricity for industry in each of the 30 states studied. In other words, investing in energy efficiency in pump systems will result in millions of dollars in savings for companies, utilities, and tax payers. This will also result in creation of thousands of jobs for local communities in each state. In addition, the electricity savings will subsequently result in reduction in GHG emissions and other air pollutions from power plants. The combined GHG reduction potential from energy efficiency in industrial pump systems in Florida, Texas, and Louisiana is over 11 Billion lb of CO2 emissions per year.

These efficiency improvements will have absolutely no negative impact on production or services served by the pump systems. These are just commercially available system optimization measures which will result in both energy and cost savings as well as GHG emissions reduction.

Above, I just gave you an example of industrial pump systems. If you add other motor systems such as fan systems, compressor systems, etc. and also motor systems in other sectors (buildings, power sector, agriculture sector, etc.), the absolute energy saving, cost savings, and GHG emissions reductions will be up to 5 times higher than what was mentioned above for the industrial pump systems.

In addition to the industrial pump systems reports mentioned above, we have also published separate reports to quantify energy use, energy saving, and GHG emissions reduction potentials and cost-effectiveness of efficiency technologies and measures in industrial fan systems and industrial compressed air systems in 30 different states in the U.S. 

See Reports: U.S. Industrial Motor Systems Energy Efficiency Reports Covering 30 States >>

Don't forget to Follow us on LinkedIn and Facebook to get the latest about our new blog posts, projects, and publications.


Available Now: Reports on Electricity Saving Potentials in U.S. Industrial Motor Systems

demand response.jpg

In the U.S., industrial electric motor systems account for over 70% of manufacturing electricity consumption. Motors are used to drive pumps, fans, compressed air systems, material handling, processing systems and more. Industrial motor systems represent a largely untapped cost-effective source for industrial energy efficiency savings that could be realized with existing commercialized technologies. A major barrier to effective policy making for government and utilities in the U.S. related to energy efficiency improvement in industrial motor systems is the lack of information and data on the magnitude and cost-effectiveness of these energy savings potential in each state in the U.S. and a comprehensive strategy and roadmap.

Global Efficiency Intelligence, LLC has been working on an initiative to study and analyze the industrial motor systems in different states in the United States. We have 30 States from different regions in the U.S. that are included in this initiative. All top 20 U.S. states in terms of industrial energy consumption are included in this initiative. We work with various public and private stakeholders on this project. This initiative focuses on industrial pumps, fans, and compressed air systems which together account for over 80% of electricity use in industrial motor systems in the U.S. We conduct various analyses at the state-level such as analyzing the energy use by each motor system type and system size at manufacturing subsector level (e.g. chemical, food, textile, steel, machinery, pulp and paper, etc.), analyzing energy saving potentials and cost by technology and system size for each state, analyzing barriers and drivers to energy efficiency and system optimization in industrial motor systems in each state, and analyzing policy making and market implications for each state.

Don't forget to Follow us on LinkedIn and Facebook to get the latest about our new blog posts, projects, and publications.

Infographic: The Profile of Energy Use in Industrial Motor Systems

According to International Energy Agency, around half of the electricity used globally is consumed in electric motor systems. Industrial motor systems account for around 70% of manufacturing electricity consumption in different countries. The inforgraphic below is prepared by Global Efficiency Intelligence, LLC to summarize some key information on energy use in motor systems worldwide.

Global Efficiency Intelligence, LLC is working on Global Motor Systems Efficiency Initiative and the U.S. Motor Systems Efficiency Initiative (covers 30 states in the U.S.) to analyze the energy use in industrial motor systems and energy efficiency potentials in these systems at manufacturing subsectors level in different countries or states in the U.S. For more information, click on the links above to see our projects page.

Available Now: U.S. Industrial Motor Systems Energy Efficiency Reports >>

Don't forget to Follow us on LinkedIn and Facebook to get the latest about our new blog posts, projects, and publications.

18 Emerging Technologies and 180 Commercialized Technologies and Measures for Energy and Water Efficiency, and GHG Emissions Reduction in the Textile Industry

The textile industry uses large amounts of electricity, fuel, and water, with corresponding greenhouse gas emissions (GHGs) and contaminated effluent.  With regard to energy use, the textile industry’s share of fuel and electricity use within the total final energy use of any one country depends on the structure of the textile industry in that country. For instance, electricity is the dominant energy source for yarn spinning whereas fuels are the major energy source for textile wet processing.

In addition to using substantial energy, textile manufacturing uses a large amount of water, particularly for wet processing of materials, and produces a significant volume of contaminated effluent. Conserving water and mitigating water pollution will also be part of the industry’s strategy to make its production processes more environmentally friendly, particularly in parts of the world where water is scarce.

In 2016, the world’s population was 7.4 billion; this number is expected to grow to 9.5 billion by 2050. The bulk of this growth will take place in underdeveloped and developing countries. As the economy in these countries improves, residents will have more purchasing power; as a result, per-capita consumption of goods, including textiles, will increase. In short, future population and economic growth will stimulate rapid increases in textile production and consumption, which, in turn, will drive significant increases in the textile industry’s absolute energy use, water use, and carbon dioxide (CO2) and other environmentally harmful emissions.

Having the higher education background in both textile technology engineering and energy efficiency technologies, I wrote a report on commercially available energy-efficiency technologies and measures for the textile industry several years ago. This report included a review of over 180 commercialized energy efficiency technologies and measures for the textile industry based on case-studies around the world. In addition to conserving energy, some of the technologies and measures presented also conserve water. The report can be downloaded from this Link (Hasanbeigi 2010).

Several other reports also document the application of commercialized technologies. However, today, given the projected continuing increase in absolute textile production, future reductions (e.g., by 2030 or 2050) in absolute energy use and CO2 emissions will require further innovation in this industry. Innovations will likely include development of different processes and materials for textile production or technologies that can economically capture and store the industry’s CO2 emissions. The development of these emerging technologies and their deployment in the market will be a key factor in the textile industry’s mid- and long-term climate change mitigation strategies.

However, information is scarce and scattered regarding emerging or advanced energy-efficiency and low-carbon technologies for the textile industry that have not yet been commercialized. That was why a few years ago, I wrote another report that consolidated available information on 18 emerging technologies for the textile industry with the goal of giving engineers, researchers, investors, textile companies, policy makers, and other interested parties easy access to a well-structured database of information on this topic. Table below shows the list of the technologies covered.

Table. Emerging energy-efficiency, water efficiency, and GHG emissions reduction technologies for the textile industry (Hasanbeigi 2015)

A few years ago when I conducted several day-long training on energy efficiency in the textile industry for hundreds of engineers and manager of textile companies in China, one major feedback we received, which did not surprise me, was that they did not know about most of the commercialized and emerging technologies we introduced. Engineers and manager are busy with day-to-day routine which rarely involves energy efficiency improvement.  

Also, you can check out the Energy Efficiency Assessment and Greenhouse Gas Emission Reduction Tool for the Textile Industry (EAGER Textile), which we developed a few years ago. EAGER Textile tool allows users to conduct a simple techno-economic analysis to evaluate the impact of selected energy efficiency measures in a textile plant by choosing the measures that they would likely introduce in a facility, or would like to evaluate for potential use.

Don't forget to Follow us on LinkedIn and Facebook to get the latest about our new blog posts, projects, and publications.

Some of our related publications are:

1.     Hasanbeigi, Ali; Price, Lynn; (2015). A Technical Review of Emerging Technologies for Energy and Water Efficiency and Pollution Reduction in the Textile Industry. Journal of Cleaner Production. DOI 10.1016/j.jclepro.2015.02.079.

2.     Hasanbeigi, Ali; Hasanabadi, Abdollah; Abdolrazaghi, Mohamad, (2012). Energy Intensity Analysis for Five Major Sub-Sectors of the Textile Industry. Journal of Cleaner Production 23 (2012) 186-194

3.     Hasanbeigi, Ali; Price, Lynn (2012). A Review of Energy Use and Energy Efficiency Technologies for the Textile Industry. Renewable and Sustainable Energy Reviews 16 (2012) 3648– 3665.

References:

·      Hasanbeigi, Ali (2013). Emerging Technologies for an Energy-Efficient, Water-Efficient, and Low-Pollution Textile Industry. Berkeley, CA: Lawrence Berkeley National Laboratory. LBNL-6510E

·      Hasanbeigi, Ali, (2010). Energy Efficiency Improvement Opportunities for the Textile Industry. Berkeley, CA: Lawrence Berkeley National Laboratory. LBNL-3970E


56 Emerging Technologies for Energy-efficiency and GHG Emissions Reduction in the Iron and Steel Industry

Iron and steel manufacturing is one of the most energy-intensive industries worldwide. In addition, use of coal as the primary fuel for iron and steel production means that iron and steel production has among the highest carbon dioxide (CO2) emissions of any industry. According to the International Energy Agency, the iron and steel industry accounts for the largest share – approximately 27 percent – of CO2 emissions from the global manufacturing sector.

Figure 1: World steel production in 2015 by countries and regions (worldsteel 2016)

Figure 1: World steel production in 2015 by countries and regions (worldsteel 2016)

China accounts for around half of the world’s steel production. Annual world steel demand is expected to grow from approximately 1,410 million tonnes (Mt) of crude steel in 2010 to approximately 2,200 Mt in 2050. The bulk of this growth will take place in China, India, and other developing countries in Asia (Bellevrat and Menanteau 2008). This significant increase in steel consumption and production will drive a significant increase in the industry’s absolute energy use and CO2 emissions.

Studies have documented the potential to save energy by implementing commercially-available energy-efficiency technologies and measures in the iron and steel industry worldwide. However, today, given the projected continuing increase in absolute steel production, future reductions (e.g., by 2030 or 2050) in absolute energy use and CO2 emissions will require further innovation in this industry. Innovations will likely include development of different processes and materials for steel production or technologies that can economically capture and store the industry’s CO2 emissions. The development of these emerging technologies and their deployment in the market will be a key factor in the iron and steel industry’s mid- and long-term climate change mitigation strategies.

Many studies from around the world have identified sector-specific and cross- energy-efficiency technologies for the iron and steel industry that have already been commercialized (See figure below). However, information is scarce and scattered regarding emerging or advanced energy-efficiency and low-carbon technologies for the steel industry that have not yet been commercialized.

Figure 2: Commercialized energy efficiency technologies and measures for iron and steel industry (Source: IIP, 2012)

Figure 2: Commercialized energy efficiency technologies and measures for iron and steel industry (Source: IIP, 2012)

My colleagues at Lawrence Berkeley National Laboratory and I wrote a report that consolidated available information on emerging technologies for the iron and steel industry with the goal of giving engineers, researchers, investors, steel companies, policy makers, and other interested parties easy access to a well-structured database of information on this topic.

The information about the 56 emerging technologies for the steel industry was covered in the report and was presented using a standard structure for each technology. Table below shows the list of the technologies covered.

Table 1. Emerging energy-efficiency and CO2 emissions-reduction technologies for the iron and steel industry (Hasanbeigi et al. 2013)

Shifting away from conventional processes and products will require a number of developments including: education of producers and consumers; new standards; aggressive research and development to address the issues and barriers confronting emerging technologies; government support and funding for development and deployment of emerging technologies; rules to address the intellectual property issues related to dissemination of new technologies; and financial incentives (e.g. through carbon trading mechanisms) to make emerging low-carbon technologies, which might have a higher initial costs, competitive with the conventional processes and products.

Our report is published on LBNL’s website and can be downloaded from this Link. Please feel free to contact me if you have any question.

Don't forget to Follow us on LinkedIn and Facebook to get the latest about our new blog posts, projects, and publications.

Some of our related publications are:

  1. Hasanbeigi, Ali; Arens, Marlene; Rojas-Cardenas, Jose; Price, Lynn; Triolo, Ryan. (2016). Comparison of Carbon Dioxide Emissions Intensity of Steel Industry in China, Germany, Mexico, and the United States. Resources, Conservation and Recycling. Volume 113, October 2016, Pages 127–139

  2. Zhang, Qi; Hasanbeigi, Ali; Price, Lynn; Lu, Hongyou; Arens, Marlen (2016). A Bottom-up Energy Efficiency Improvement Roadmap for China’s Iron and Steel Industry up to 2050. Berkeley, CA: Lawrence Berkeley National Laboratory. LBNL- 1006356

  3. Morrow, William; Hasanbeigi, Ali; Sathaye, Jayant; Xu, Tengfang. 2014. Assessment of Energy Efficiency Improvement and CO2 Emission Reduction Potentials in India’s Cement and Iron & Steel Industries. Journal of Cleaner Production. Volume 65, 15 February 2014, Pages 131–141

  4. Hasanbeigi, Ali; Price, Lynn, Aden, Nathaniel; Zhang Chunxia; Li Xiuping; Shangguan Fangqin. 2014. Comparison of Iron and Steel Production Energy Use and Energy Intensity in China and the U.S. Journal of Cleaner Production, Volume 65, 15 February 2014, Pages 108–119

  5. Hasanbeigi, Ali; Morrow, William; Sathaye, Jayant; Masanet, Eric; Xu, Tengfang. (2013). A Bottom-Up Model to Estimate the Energy Efficiency Improvement and CO2 Emission Reduction Potentials in the Chinese Iron and Steel Industry. Energy, Volume 50, 1 February 2013, Pages 315-325

  6. Hasanbeigi, A., Price, L., Aden, N., Zhang C., Li X., Shangguan F. 2011. A Comparison of Iron and Steel Production Energy Use and Energy Intensity in China and the U.S. Berkeley CA: Lawrence Berkeley National Laboratory Report LBNL-4836E.

References:

  • Bellevrat, E., P. Menanteau. 2008. “Introducing carbon constraint in the steel sector: ULCOS scenarios and economic modeling.” Proceedings of the 4th Ulcos seminar, 1-2 October.

  • Hasanbeigi, Ali; Arens, Marlene; Price, Lynn; (2013). Emerging Energy Efficiency and CO2 Emissions Reduction Technologies for the Iron and Steel Industry. Berkeley, CA: Lawrence Berkeley National Laboratory BNL-6106E.

  • Institute for Industrial Productivity. 2012. Iron and Steel technologies http://ietd.iipnetwork.org/content/iron-and-steel

  • worldsteel Association. 2016. World steel in figures.


Structural Change in Chinese Steel Industry and Its Impact on Energy Use and GHG Emissions up to 2030

Production of iron and steel is an energy-intensive and air polluting manufacturing process. In 2014, the iron and steel industry accounted for around 28 percent of primary energy consumption of Chinese manufacturing (NBS 2015a). Steel production in 2015 was 804 Mt (worldsteel, 2016), representing 49.5% of the world production that year (Figure 1).

Figure 1. China’s Crude Steel Production and Share of Global Production (1990-2015) (EBCISIY, various years; NBS, 2015b, worldsteel 2016)

Figure 1. China’s Crude Steel Production and Share of Global Production (1990-2015) (EBCISIY, various years; NBS, 2015b, worldsteel 2016)

China is a developing country and the iron and steel industry, as a pillar industry for Chinese economic development, has grown rapidly along with the national economy. The average annual growth rate of crude steel production was around 18% between 2000 and 2010. China’s steel production in 2014 consumed around 580 TWh of electricity and 18,013 PJ of fuel (NBS 2015a).

The promotion and application of energy-saving technologies has become an important step for increasing energy efficiency and reducing energy consumption of steel enterprises, especially during the 11th Five Year Plan (FYP) (2006-2010) and 12th FYP (2011-2015). During this time, energy-efficiency technologies adopted in China’s steel industry included: Coke Dry Quenching (CDQ), Top-pressure Recovery Turbine (TRT), recycling converter gas, continuous casting, slab hot charging and hot delivery, Coal Moisture Control (CMC), and recycling waste heat from sintering. The penetration level of energy-efficiency technologies in the steel industry has improved greatly in China, improving its energy efficiency and emissions reductions (Hasanbeigi et al. 2011).

Couple of years ago, my colleagues and I conducted a study that aimed to analyze influential factors that affected the energy use of steel industry in the past in order to quantify the likely effect of those factors in the future. For the first time, we developed a decomposition analysis method that can be used for the steel industry to analyze the effect of different factors including structural change on energy use of the steel industry.

The factors we analyzed were:

  1. Activity: Represents the total crude steel production.

  2. Structure: Represents the activity share of each process route (Blast Furnace/Basic Oxygen Furnace (BF-BOF) or Electric Arc Furnace (EAF) route).

  3. Pig iron ratio: The ratio of pig iron used as feedstock in each process route. This is especially important for the EAF process because the higher the pig iron ratio in the feedstock of the EAF, the higher the energy intensity of EAF steel production.

  4. Energy intensity: Represents energy use per ton of crude steel

In that study, a bottom-up analysis of the energy use of key medium- and large-sized Chinese steel enterprises (which account for around 85% of steel production in China) was performed using data at the process level. Both retrospective and prospective analyses were conducted in order to assess the impact of factors that influence the energy use of the steel industry in the past and estimate the likely impact in the future up to 2030.

Three scenarios were developed as follows:

o   Scenario 1: Low scrap usage: the share of EAF steel production grows slower and the pig iron feed ratio in EAF drops slower than other scenarios

o   Scenario 2: Medium scrap usage: the rate of growth in the share of EAF steel production and the drop in the pig iron feed ratio in EAF production is medium (between scenario 1 and 3)

o   Scenario 3: High scrap usage: the share of EAF steel production grows faster and the pig iron feed ratio in EAF production drops faster than other scenarios.

Figure 2 shows the energy intensities calculated for different steel production route up 2030

Figure 2. Final energy intensities calculated for key medium- and large-sized Chinese steel enterprises (2000-2030)

Figure 2. Final energy intensities calculated for key medium- and large-sized Chinese steel enterprises (2000-2030)

The results of our analysis showed that although total annual crude steel production of key Chinese steel enterprises (and most likely entire Chinese steel industry) is assumed to peak in 2030 under all scenarios, total final energy use of the key Chinese steel enterprises (and most likely the entire Chinese steel industry) peaks earlier, i.e. in year 2020 under low and medium steel scrap usage scenarios and in 2015 under high scrap usage scenario (Figure 3).

Figure 3. Total final energy use in key medium- and large-sized Chinese steel enterprises under each scenario (2000-2030)

Figure 3. Total final energy use in key medium- and large-sized Chinese steel enterprises under each scenario (2000-2030)

Energy intensity reduction of the production processes and structural shift from Blast Furnace/Basic Oxygen Furnace (BF-BOF) to Electric Arc Furnace (EAF) steel production plays the most significant role in the final energy use reduction. The decomposition analysis results showed what contributed to the reduction in the final energy use and its peak under each scenario. Figure 4 shows an example of results for Medium scrap usage scenario. 

The three scenarios produced for the forward looking decomposition analysis up to 2030 showed the structural effect is negative (i.e. reducing the final energy use) during 2010-2030 because of the increase in the EAF share of steel production in this period. Similarly, the pig iron ratio effect reduces the final energy use of key steel enterprises because of reduction in the share of pig iron used as feedstock in EAF steel production during this period. High scrap usage scenario had the largest structural effect and pig iron ratio effect because of higher EAF steel production and lower pig iron use in EAFs in this scenario.

Figure 4. Medium scrap usage scenario: Results of prospective decomposition of final energy use of key medium- and large-sized Chinese steel enterprises up to 2030

Figure 4. Medium scrap usage scenario: Results of prospective decomposition of final energy use of key medium- and large-sized Chinese steel enterprises up to 2030

The intensity effect also played a significant role in reducing final energy use of steel manufacturing during 2010-2030. This is primarily because of the energy intensity assumptions for production processes in 2020 and 2030. While the realization of such energy intensity reduction is uncertain and remains to be seen in the future, the aggressive policies by the Chinese government to reduce the energy use per unit of product of the energy intensive sectors, especially the steel sector, are a promising sign that the Chinese steel industry is moving towards those energy intensity targets. The “Top-10,000 Enterprises Energy Saving Program” and the “10 Key Energy Saving Projects Program” along with other policies and incentives in the coming years will significantly help to reduce the energy intensity of the steel industry in China.

More details of our analysis and results are presented in our report that is published on LBNL’s website and can be downloaded from this Link.

Please feel free to contact me if you have any question. Don't forget to follow us on LinkedInFacebook, and Twitter to get the latest about our new blog posts, projects, and publications.

Some of our related publications are:

  1. Hasanbeigi, Ali; Arens, Marlene; Rojas-Cardenas, Jose; Price, Lynn; Triolo, Ryan. (2016). Comparison of Carbon Dioxide Emissions Intensity of Steel Industry in China, Germany, Mexico, and the United States. Resources, Conservation and Recycling. Volume 113, October 2016, Pages 127–139

  2. Zhang, Qi; Hasanbeigi, Ali; Price, Lynn; Lu, Hongyou; Arens, Marlen (2016). A Bottom-up Energy Efficiency Improvement Roadmap for China’s Iron and Steel Industry up to 2050. Berkeley, CA: Lawrence Berkeley National Laboratory. LBNL- 1006356

  3. Morrow, William; Hasanbeigi, Ali; Sathaye, Jayant; Xu, Tengfang. 2014. Assessment of Energy Efficiency Improvement and CO2 Emission Reduction Potentials in India’s Cement and Iron & Steel Industries. Journal of Cleaner Production. Volume 65, 15 February 2014, Pages 131–141

  4. Hasanbeigi, Ali; Price, Lynn, Aden, Nathaniel; Zhang Chunxia; Li Xiuping; Shangguan Fangqin. 2014. Comparison of Iron and Steel Production Energy Use and Energy Intensity in China and the U.S. Journal of Cleaner Production, Volume 65, 15 February 2014, Pages 108–119

  5. Hasanbeigi, Ali; Morrow, William; Sathaye, Jayant; Masanet, Eric; Xu, Tengfang. (2013). A Bottom-Up Model to Estimate the Energy Efficiency Improvement and CO2 Emission Reduction Potentials in the Chinese Iron and Steel Industry. Energy, Volume 50, 1 February 2013, Pages 315-325

  6. Hasanbeigi, Ali; Arens, Marlene; Price, Lynn; (2013). Emerging Energy Efficiency and CO2 Emissions Reduction Technologies for the Iron and Steel Industry. Berkeley, CA: Lawrence Berkeley National Laboratory BNL-6106E.


References

Editorial Board of China Iron and Steel Industry Yearbook (EBCISIY). Various years. China Iron and Steel Industry Yearbook. Beijing, China (in Chinese).

Hasanbeigi, A., Price, L., Aden, N., Zhang C., Li X., Shangguan F. 2011. A Comparison of Iron and Steel Production Energy Use and Energy Intensity in China and the U.S. Berkeley CA: Lawrence Berkeley National Laboratory Report LBNL-4836E.

NBS. 2015a. China Energy Statistics Yearbook 2015. Beijing: China Statistics Press.

NBS. 2015b. China Statistical Yearbook 2015. Beijing: China Statistics Press.

World Steel Association (worldsteel). 2016. Steel Statistical Yearbook 2016. 


Moving Beyond Equipment and to System Efficiency: Massive Energy Efficiency Potential in Industrial Steam Systems in China

China is responsible for nearly 20% of global energy use and 25% of global energy-related CO2 emissions. The industrial sector dominates the country’s total energy consumption, accounting for about 70% of primary energy use and also country’s CO2 emissions. For these reasons, the development path of China’s industrial sector will greatly affect future energy demand and dynamics of not only China, but the entire world.

Sources: NBS, China Energy Statistical Yearbooks 2015. EIA, 2015

Sources: NBS, China Energy Statistical Yearbooks 2015. EIA, 2015

Steam is used extensively as a means of delivering energy to industrial processes. On average, industrial boiler and steam systems account for around 30% of manufacturing industry energy use worldwide. There exists a significant potential for energy efficiency improvement in steam systems; however, this potential is largely unrealized. A major barrier to effective policymaking, and to more global acceptance of the energy efficiency potential of steam systems, is the lack of a transparent methodology for quantifying steam system energy efficiency potential based on sufficient data to document the magnitude and cost-effectiveness of these energy savings by country and by region.

Source: U.S. DOE/AMO, 2012

Source: U.S. DOE/AMO, 2012

In 2013-2014, I led a UNIDO-funded study to develop and apply a steam system energy efficiency cost curve modeling framework to quantify the energy saving potential and associated costs of implementation of an array of boiler and steam system optimization measures. The developed steam systems energy efficiency cost curve modeling framework was used to evaluate the energy efficiency potential of coal-fired boiler (around 83% of industrial boilers) and steam systems in China’s industrial sector. Nine energy-efficiency technologies and measures for steam systems are analyzed.

The study found that total cost-effective (i.e. the cost of saving a unit of energy is lower than purchasing a unit of energy) and technically feasible fuel savings potential in industrial coal-fired steam systems in China in 2012 was 1,687 PJ and 2,047 PJ, respectively. These account for 23% and 28% of the total fuel used in industrial coal-fired steam systems in China in that year, respectively. The CO2 emission reduction potential associated with the cost-effective and total technical potential is equal to 165.82 MtCO2 and 201.23 MtCO2, respectively. By comparison, the calculated technical fuel saving potential for industrial coal-fired steam systems in China is approximately 9% of the total coal plus coke used in Chinese manufacturing in 2012 and is greater than the total primary energy use of over 160 countries in the world in 2010.

Several sensitivity analyses were conducted, their policy implications discussed, and uncertainties and limitations of this study were presented in the report we published. Our report is published by UNIDO and can be downloaded from here. Please feel free to contact me if you have any question.

Don't forget to follow us on LinkedInFacebook, and Twitter to get the latest about our new blog posts, projects, and publications.


Utilities large missed opportunity: Demand Response in manufacturing

Demand Response (DR) helps utilities to manage the peak electricity demand by temporarily shifting the demand on the consumer side instead of building new power plants to meet the short-time peak demand. On the other hand, customers use demand response to reduce their electrical cost using the time-of-use price signals. Nowadays, work is underway to automate the process using automated demand response (AutoDR).

In this post I will not get into the details of DR or AutoDR and rather discuss the DR potential in the manufacturing sector. I believe one of the main barriers to DR in manufacturing is that the DR potential in this sector is not well understood by utilities, companies and other parties involved.

Based on my experience on energy efficiency and demand side management in industry in the past 10 years, for a manufacturing sector or process to have a great potential for Demand Response (DR), it should have one or more of the four characteristics shown in the figure below.

Note: A bottleneck is a stage in a process that causes the entire process and the production rate of the final product to slow down.

Let me open this by giving a few examples below from an energy-intensive industry (cement industry) and a non-energy-intensive industry (textile industry).

Example 1- DR potential in the cement industry:

In a simple form, cement production process consists of raw material (mostly limestone) grinding, high temperature kiln for clinker making, and finish grinding of clinker and some additives into cement.

The electricity use in a cement plant ranges between 90 to 150 kWh/tonne cement depending on the grinding technology, raw material properties, etc. A cement plant may have a production capacity of less than 1000 tonne per day to more than 10,000 tonne per day. Therefore, the amount of electricity use by a cement plant can be quite substantial. Over 70% of the electricity use in cement plant is used in raw material grinding and finish grinding processes.

The raw material grinding process has the following three DR-friendly characteristics:

  1. It is a batch process

  2. It has large storage capacity for its output (ground raw material) which last for hours and often for days

  3. The following process (which is kiln) can be considered a bottleneck of the production. This combined with large storage capacity before the bottleneck process (#2) provides a perfect condition for DR.

The finish grinding process has the following three DR-friendly characteristics:

  1. It is a batch process

  2. There is a large storage capacity after kiln for ground clinker (and before finish grinding), which last for hours if not days.

  3. If production scheduling is flexible, the operation of finish grinding to produce the final cement product can be delayed for a few hours while the previous process can continue their operation.

If we assume that an exemplary cement plant uses 120 kWh/tonne cement of which 70% (84 kWh/tonne cement) used in raw material grinding and finish grinding, and produces 3000 tonne cement pre day (125 tonne/hour), every hour of shift in the operation of both raw material grinding and finish grinding in response to a DR signal will result in 125*84=10,500 kWh reduction in electricity demand.

This is roughly equal to average daily electricity consumption of 350 U.S. residential utility customers. If only the production of either raw material grinding or finish grinding is shifted, this reduction will be cut by almost half. This is such a large DR potential that I am going to hope all utilities and cement companies are taking advantage of it.

Example 2- DR potential in the textile industry:

There are many DR potential in the textile industry. I have done substantial work on this sector and can talk for hours on EE and DR potential in different textile subsectors and process. However, since this post is getting a bit longer than I planned, I will just briefly mention two DR potentials for this industry. If you like to know more, feel free to contact me.

The first example for the textile industry is in the yarn production process. One of the main process is called “spinning process” which uses different machines such as Ring frame, Open-end machines, etc. The spinning process has the following two DR-friendly characteristics:

  1. It is a batch process

  2. It is a bottleneck process. Often, intermediary products that are fed into spinning machines get lined up for hours on the plant floor waiting to be processed by spinning machines. Having a proper storage capacity will allow to store enough feeding product for spinning machines and shut down the previous process, which account for around 30%-40% of electricity demand of the entire yarn production plants, for few hours during the DR period.

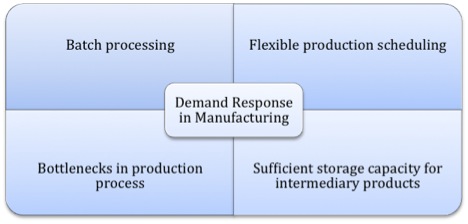
Another significant potential for DR in the textile industry is in wet-processing plants. Wet-processing plants conduct preparation, dyeing, printing, and/or finishing of yarn and fabric and other textile products. Many batch processes exist in wet-processing plants. Also, several processes like dryer, Stenter, or batch dyeing machines can be bottleneck processes that provide DR opportunity. Often wet-processing plants work on several different orders and products; thus, proper production scheduling can provide great DR opportunity. To take advantage of this, there needs to be high level of coordination between different departments within a plant who are in charge of production planning, energy management, paying utility bills, etc. Figure below illustrate the concept of DR potential in production processes with batch processing, storage capacity and a bottleneck process.

To sum up, manufacturing sector is a complex and heterogeneous sector. Even within one industry subsector (for example, textile or food industry), there are completely different subsectors. However, there are great potentials for energy saving and Demand Response in the manufacturing sector. More in-depth understanding of production processes and technologies and energy systems in each manufacturing subsector will allow us to tap into these potential. 

Please feel free to contact me if you have any question. Also, don't forget to follow us on LinkedInFacebook, and Twitter to get the latest about our new blog posts, projects, and publications.