The Payback Paradox: When Cheaper, Cleaner Steam Heat Pumps Lose to Short-Term Thinking
Author: Ali Hasanbeigi, Ph.D.
Across multiple industrial sectors, we keep seeing the same pattern. In studies we have conducted in textile, food and beverage, and other steam-intensive industries, steam heat pumps often deliver significantly lower levelized cost of heating over the technology lifetime (e.g., 20 years) compared to coal or gas boilers (find our studies here). On a lifetime cost basis, they are clearly more cost-efficient and cheaper. Yet in real investment committees and company boardrooms, these projects frequently stall because the simple payback period is often above five years. The internal thresholds for payback period in most industrial firms is less than 3 years. The result is a structural gap between long-term energy productivity and short-term financial liquidity. Unless this gap is addressed, electrified heat will remain technically sound but financially sidelined.
This is not a technology problem. It is a capital allocation problem.
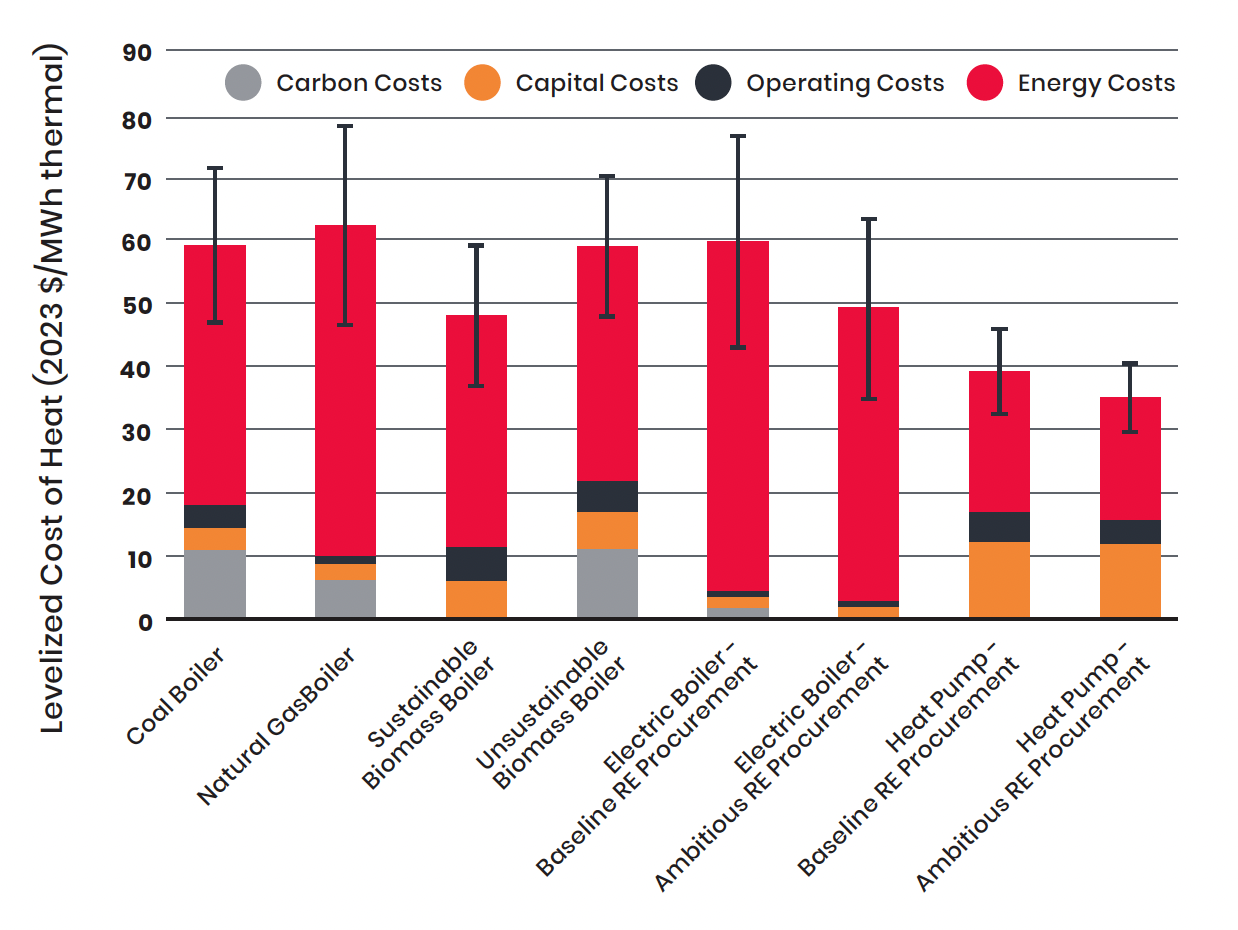
Figure 1: Levelized cost of heat (LCOH) for steam generation for different technologies and electricity supply scenarios for a typical textile wet-processing facility in China (Hasanbeigi et al. 2025)
Note: Error bars represent energy price sensitivities of +/- 30%
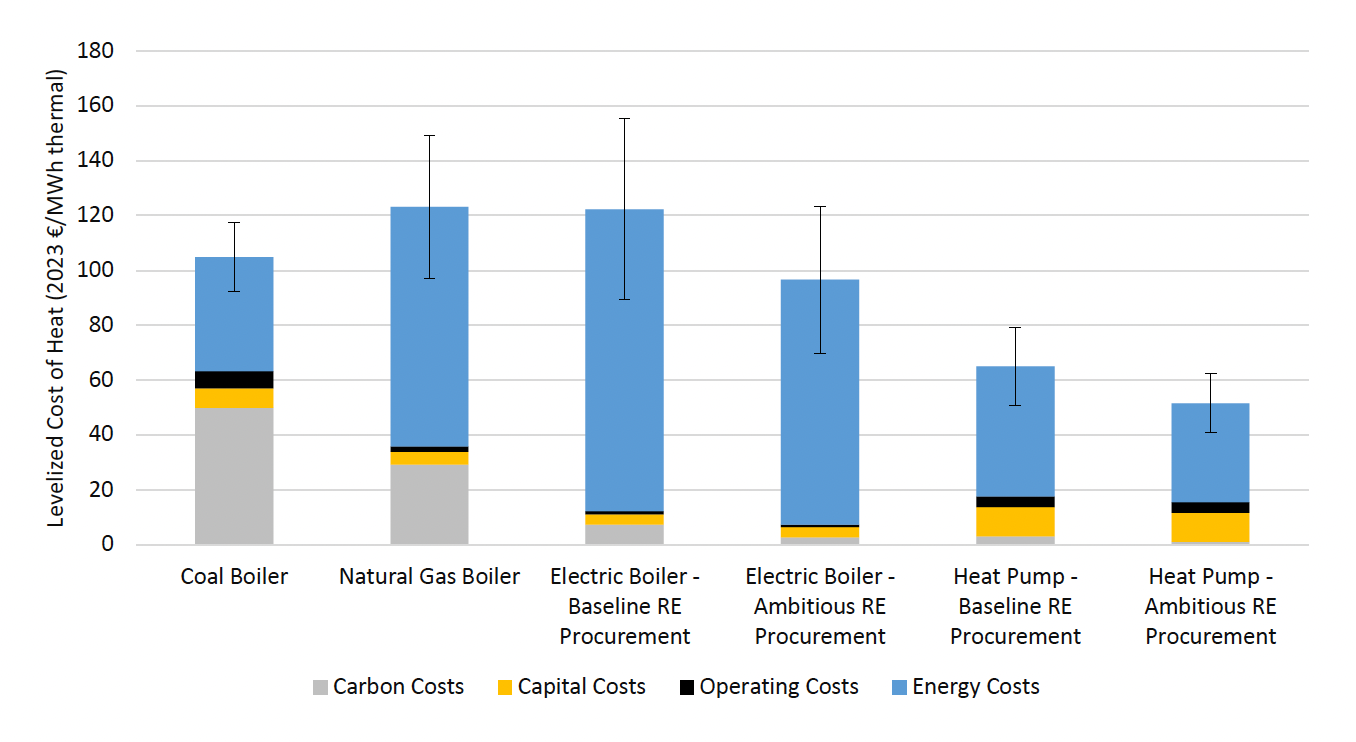
Figure 2: Levelized cost of heat (LCOH) for steam production for different technologies and electricity supply scenarios in EU27 (Hasanbeigi et al. 2024)
Note: Error bars represent energy price sensitivities of +/- 30%
Lifecycle cost metric vs liquidity metric
The tension begins with how value is measured. Levelized cost of heating is a lifecycle metric. It spreads capital cost across the asset’s lifetime and combines it with operating cost, maintenance, and financing assumptions. It answers a long-term question: what does heat truly cost over 15 or 20 years?
Simple payback is a liquidity metric. It answers a much narrower question: how many years until I recover my upfront investment?
A steam heat pump may cost three million dollars installed, compared to one million dollars for a fossil boiler of similar capacity. That threefold capital difference dominates early-year cash flow. But once operating, the heat pump uses electricity multiplied by a coefficient of performance (COP) of 2.0 - 3.0 (aka 200-300% efficeincy)for steam-generating heat pumps, delivering multiple units of thermal energy per unit of input compared to conventional fossil fuel boilers with 70%-80% efficiency. Over time, those operating savings accumulate. In many of our sector studies, that dynamic leads to a substantially lower LCOH relative to coal or gas.
LCOH rewards what happens over a decade or two. Payback only sees the first few years.
The cost of inaction: fossil heat is becoming a liability
In 2026, coal and even natural gas are no longer just energy inputs. They are risk exposures. Carbon pricing mechanisms are expanding across jurisdictions. Border carbon measures are emerging. Investor scrutiny of industrial emissions is increasing. Insurance and financing conditions are shifting in response to climate risk.
In sectors such as food and beverage, chemicals, pulp and paper, and textiles, thermal energy is often a large share of total emissions. Continuing to invest in fossil-based heat may appear safe because it aligns with traditional payback rules. But from a transition risk perspective, it increases exposure to future carbon costs, policy tightening, and customer/buyer pressure. Fossil-fired boilers are stranded assets in the age of scope 3 and supply chain decarbonization.
The much lower LCOH advantage of electrified heat is not just an efficiency story. It is increasingly a risk management story.
The decision gap in practical terms
In many facilities we have assessed, the comparison looks similar across sectors. The fossil boiler has a lower upfront cost and familiar technology. The steam heat pump has a higher upfront cost but lower operating cost and lower emissions. Over 20 years, the heat pump delivers substantially lower cost per unit of heat. Yet in boardrooms, the fossil option is labeled safe because it meets a two- or three-year payback rule, while the electrified option is labeled risky because it does not.
The paradox is that the asset with lower lifetime cost and lower regulatory exposure is often rejected because it challenges the company’s internal capital allocation norms.
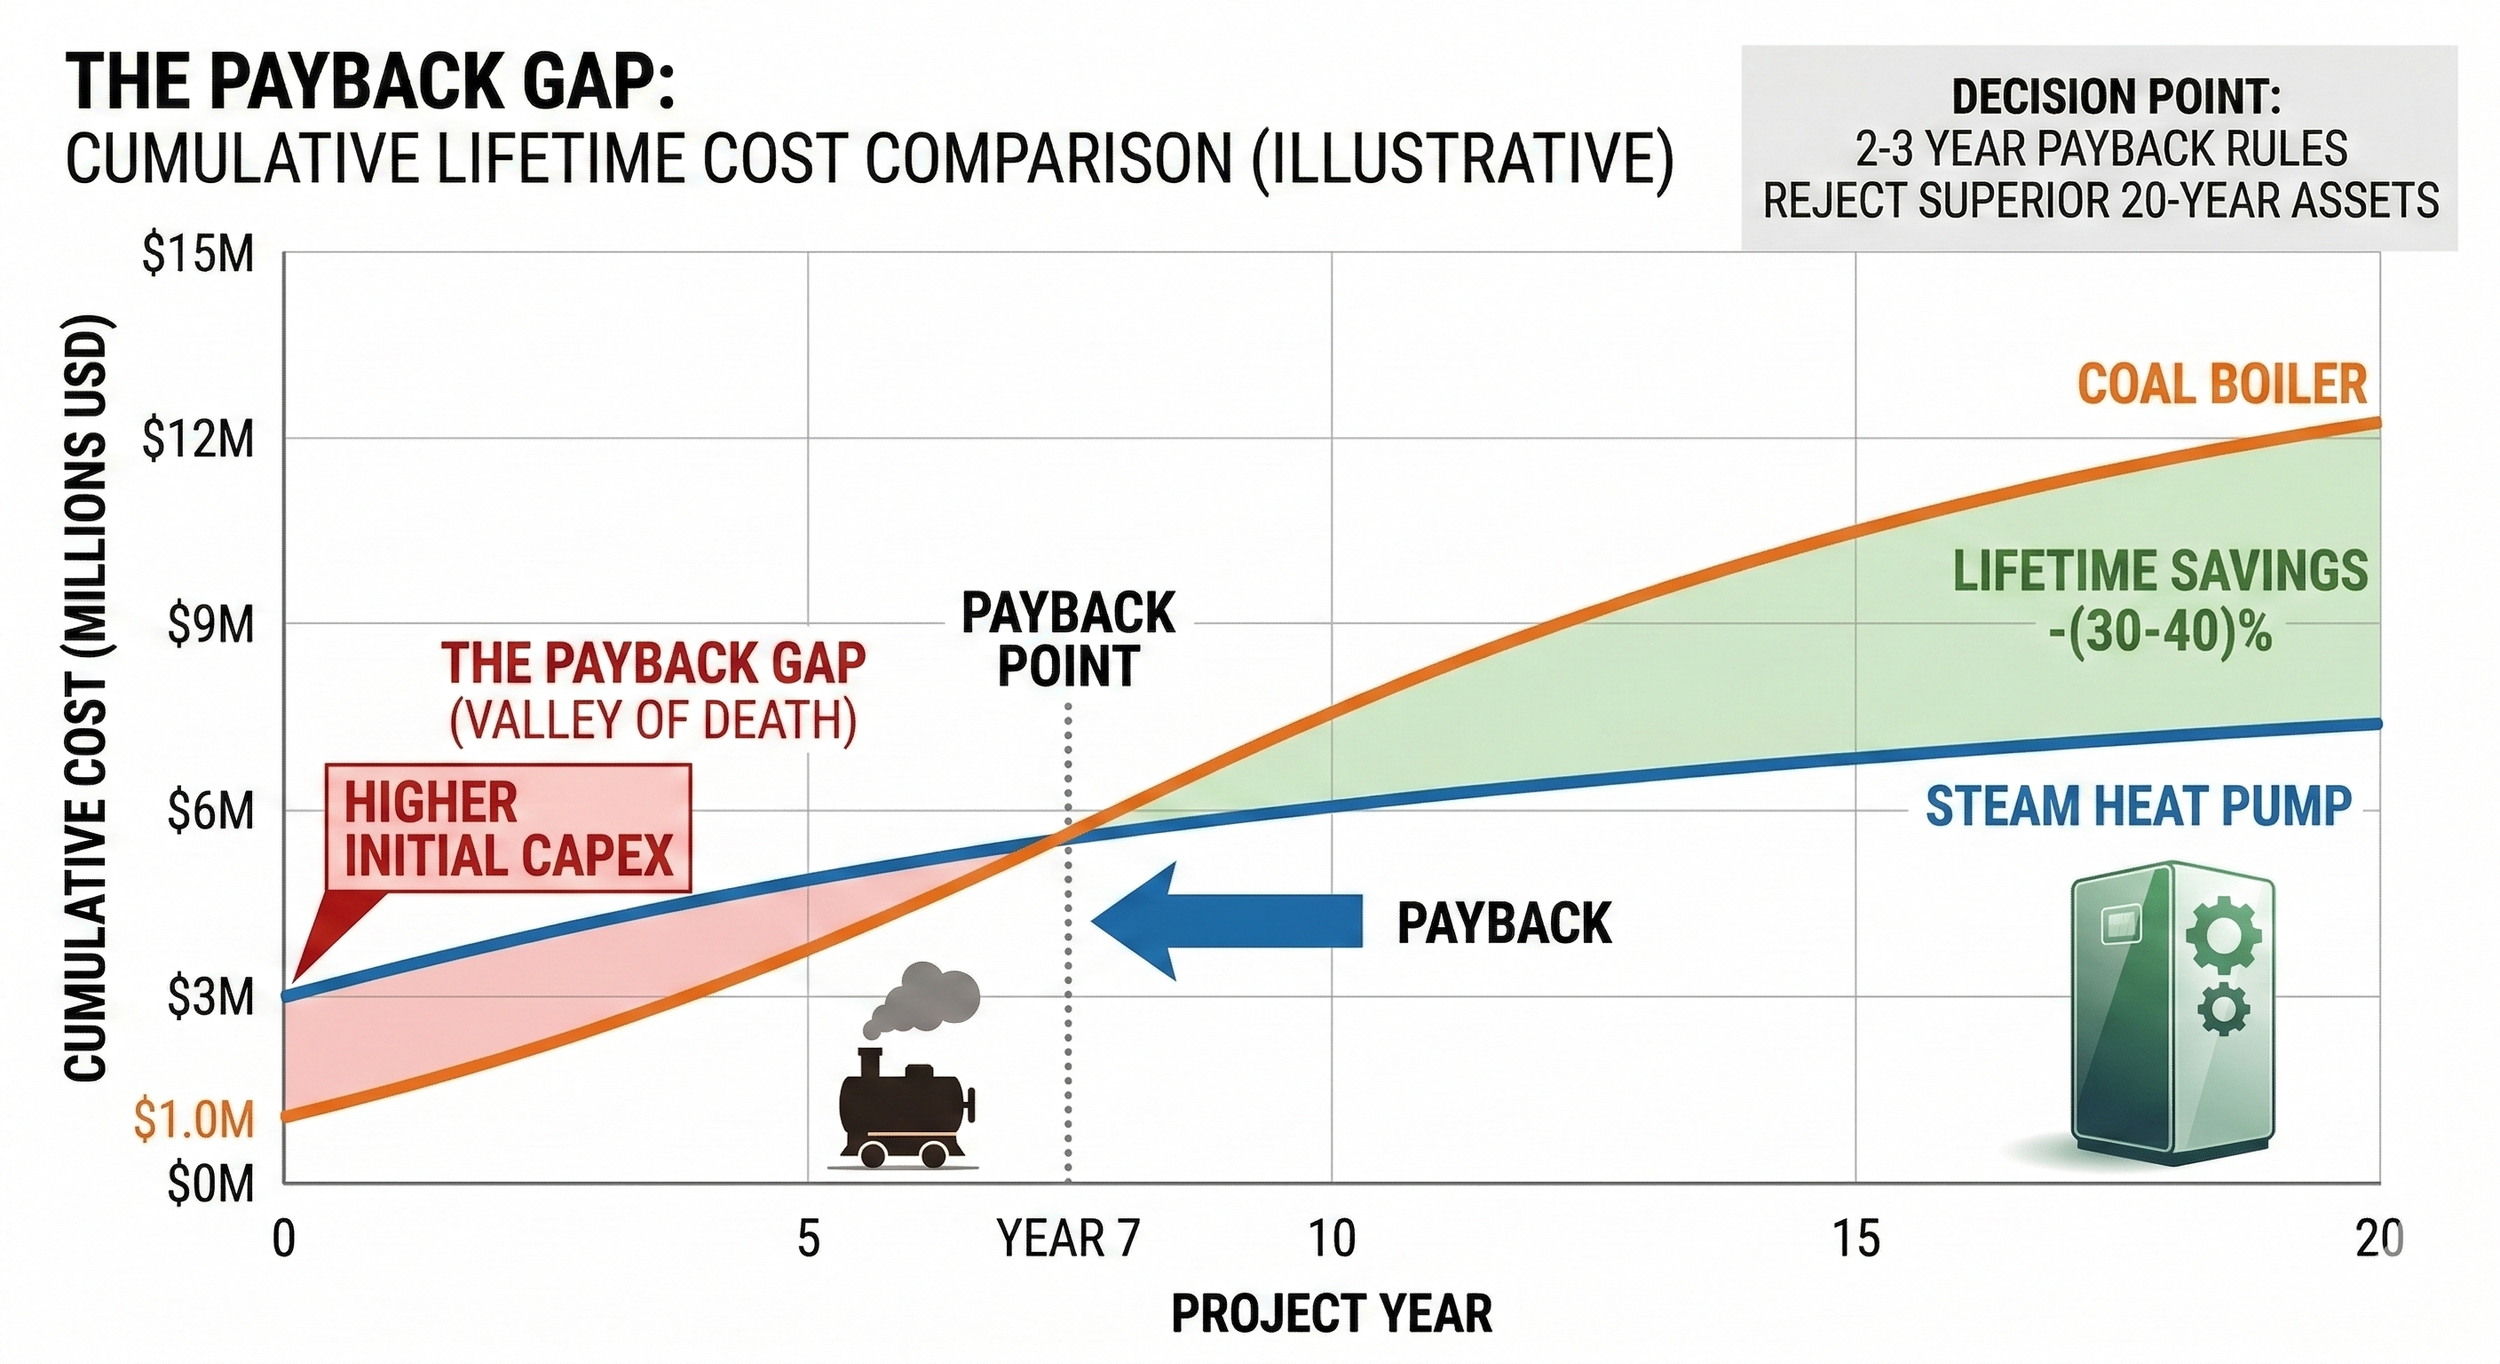
Figure 3: Illustrative comparison of cumulative lifecycle costs and payback period for a steam heat pump vs. a fossil fuel boiler
The financing reality inside industrial firms
Most industrial firms, especially small and mid-sized manufacturers, operate under tight capital constraints. Even larger corporations apply internal hurdle rates and short payback thresholds. Capital is scarce and must compete across many priorities.
A plant manager with three million dollars available does not only compare a steam heat pump with a boiler. That capital competes with production expansion, digitalization, new product lines, or automation upgrades that may deliver faster returns. Decarbonization is competing with growth.
Even if a steam heat pump delivers a strong internal rate of return over 20 years, it may lose to projects that recover capital faster. This is an opportunity cost problem. The technology may be economically superior over its lifetime, but it fails under short-term liquidity criteria.
Bridging the payback gap
Closing this gap requires reshaping cash flow rather than re-proving thermodynamics. Several levers can make a real difference.
• Carbon pricing can shorten payback. As carbon costs increase, the effective cost of fossil heat rises, boosting annual savings from electrification.
• Engineering optimization also matters. Improving heat source stability and system integration to increase COP can substantially increase HP’s operating savings.
• Capital structure innovation is also helpful. Grants, concessional loans, or blended finance structures that absorb 20 to 40 percent of heat pumps CAPEX can reduce payback from seven years to three or four. The lifetime LCOH advantage remains, but the liquidity barrier is lowered.
• Heat-as-a-service (HaaS) models go further. In these structures, a third party owns and operates the heat pump and sells heat under a long-term contract. The industrial facility avoids upfront CAPEX and pays for heat as an operating expense. This approach aligns particularly well with capital-constrained facilities and reduces internal resistance tied to payback thresholds. In addition, HaaS shifts the Performance Risk. In many boardrooms, the fear isn't just the payback; it's the fear that the HP won't hit the projected COP. HaaS places that risk on the provider, which is a massive selling point.
What this means for corporate leaders
If companies are serious about industrial decarbonization, they need to rethink how they evaluate long-lived assets. Applying two-year payback rules to 20-year major capital expenditure systematically disadvantages electrified heat. Internal rate of return (IRR), lifecycle cost (e.g., LCOH), and exposure to carbon risk should carry more weight in decision-making.
For companies with science-based targets or net-zero commitments, continuing to prioritize short-term payback over long-term resilience creates a structural conflict between strategy and capital allocation.
It’s really difficult to adopt deep decarbonization technologies using a 2-year payback period threshold.
What this means for financiers and policymakers
For financiers and policymakers, the leverage point is financial architecture. Supporting electrified heat with targeted CAPEX grants, concessional finance, or performance-based incentives can unlock projects that are already efficient on a lifecycle (LCOH) basis. Aggregation models and standardized contracts can reduce transaction costs and accelerate adoption across multiple sites.
Steam heat pumps and other electrified heat solutions are not failing because they lack technical merit. In many sectors, they already deliver lower lifetime cost than fossil alternatives. They are stalling because we are evaluating long-term industrial infrastructure with short-term liquidity metrics.
If we want industrial decarbonization to scale across industries (e.g., food and beverage, textiles, chemicals, and other steam-intensive industries), we need to align financial frameworks with engineering reality. The efficiency is already there. The question is whether our capital allocation models are ready to recognize it.
To learn more about industrial electrification, you can find our reports for different countries and industry sectors from this link.