
Author: Ali Hasanbeigi, Ph.D.
See our more recent report, “Aluminum Climate Impact 2025”, for more updated intensities and ranking.
Aluminum production accounts for 2% of global carbon dioxide (CO2) emissions. World aluminum production has more than doubled between 2000 and 2020. Much of this growth in production came from China, which accounted for 57 percent of global aluminum production in 2020. The energy use and greenhouse gas (GHG) emissions of the aluminum industry are likely to continue increasing because the increased demand for aluminum, particularly in developing countries, is outpacing the incremental decreases in energy and CO2 emissions intensity of aluminum production that are happening under the current policy and technology regime.
Last month we published a report titled “Aluminum Climate Impact - An International Benchmarking of Energy and CO2 Intensities”. In this report, we conducted a benchmarking analysis for energy and energy-related CO2 emissions intensity of the aluminum industry among the largest aluminum-producing countries. We focused on the two phases of the aluminum production value chain responsible for the vast majority of energy use and associated CO2 emissions: alumina production and the electrolysis process to produce aluminum.
Figure 1 shows the energy-related CO2 emissions intensities for aluminum production in the countries/region studied, based on our system boundary of the alumina production and electrolysis phases. Our results show that India, China, and Australia have the highest and Iceland, Norway, and Canada have the lowest energy-related CO2 emissions intensities among the countries/region studied (Figure 1).
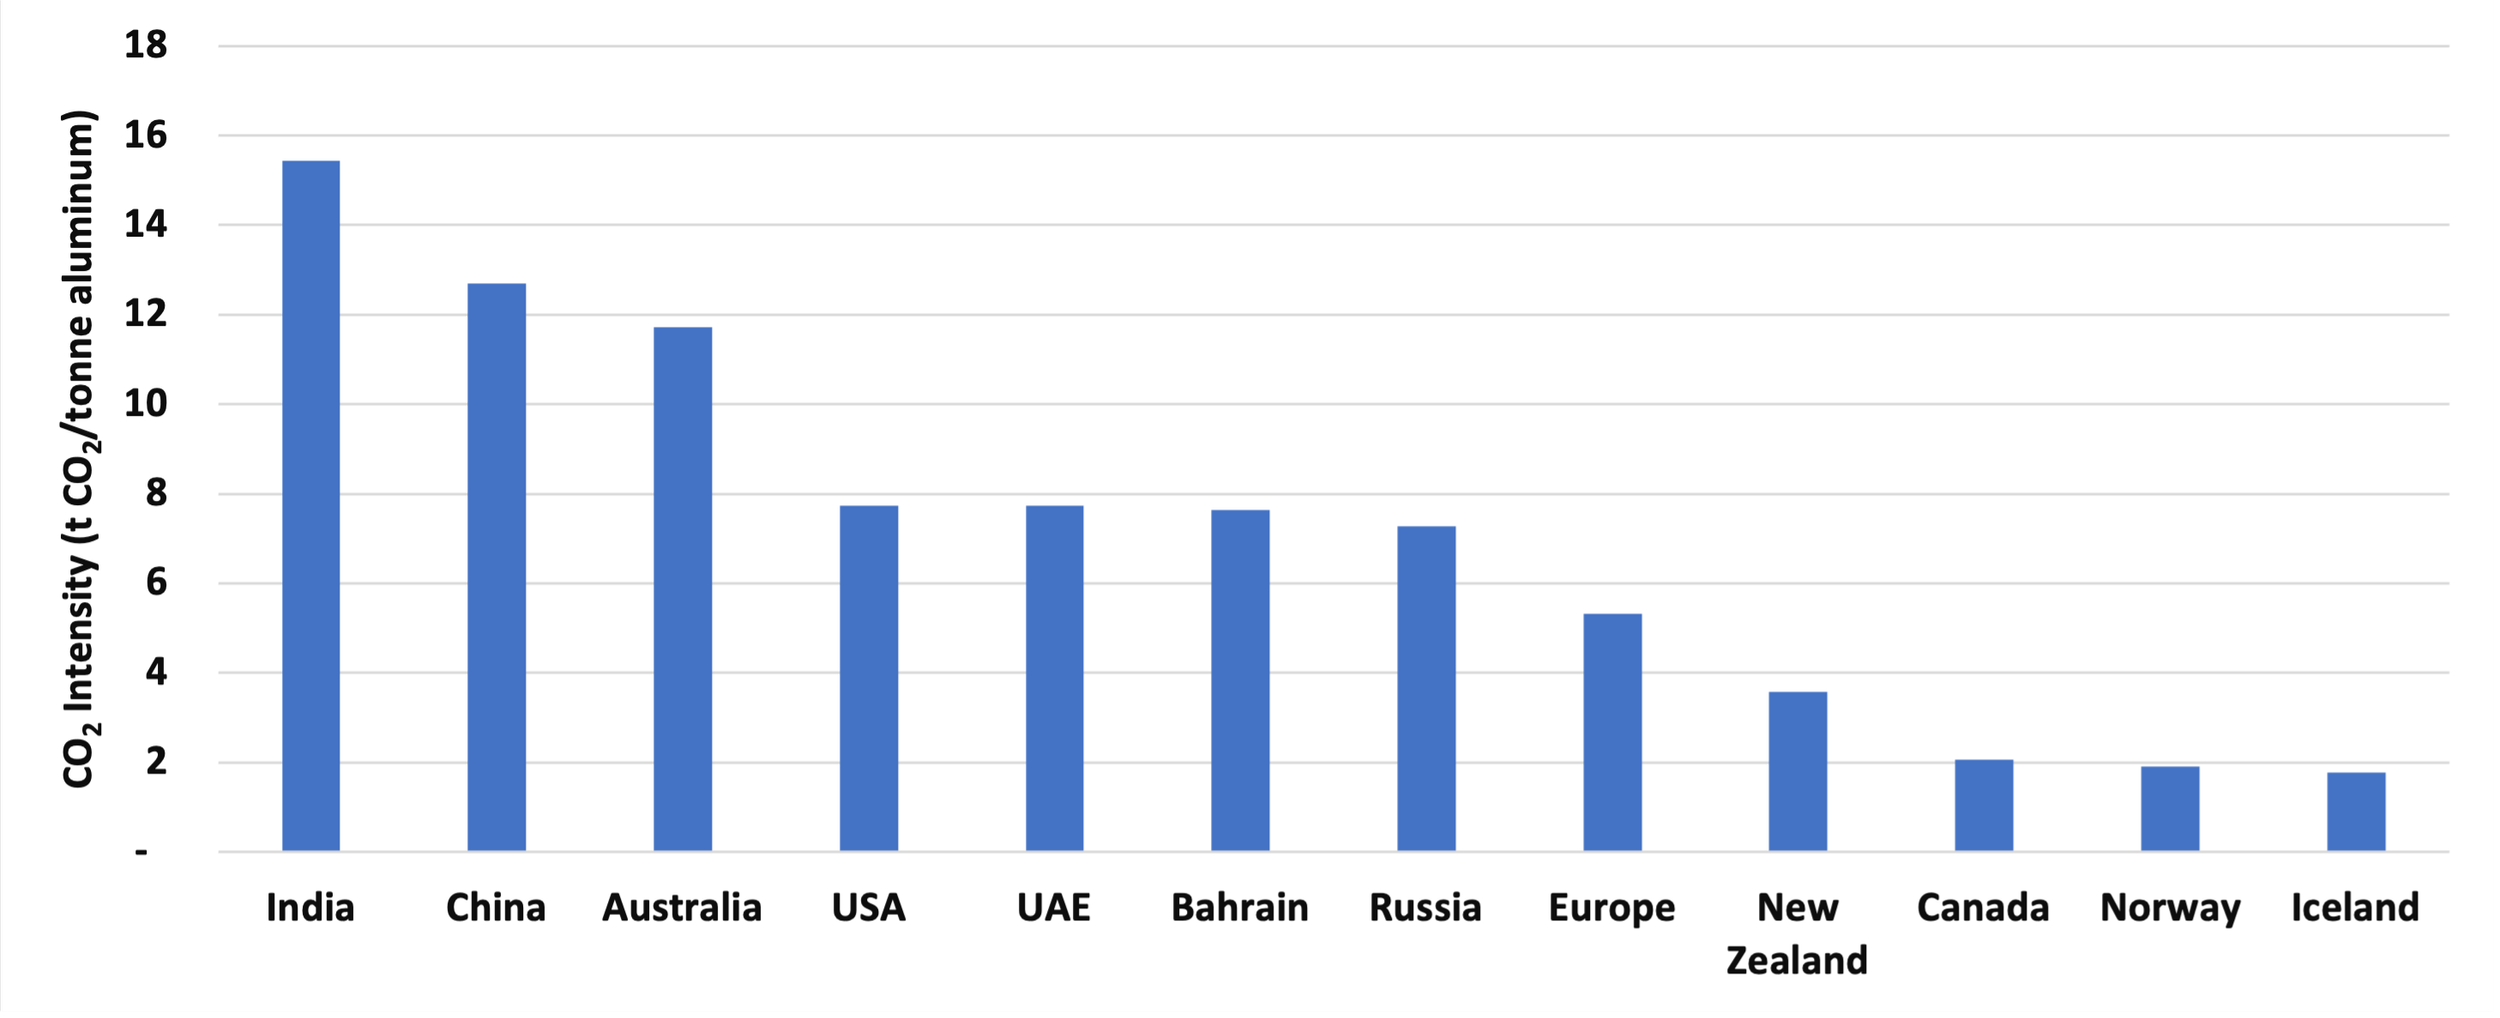
Figure 1: Final energy-related CO2 intensity of aluminum production in 2019
(Note: Both smelters and alumina production processes are included. The CO2 emissions from both electricity and fuel use are included.)
Because electricity makes up a large share of the energy used in primary aluminum production, the CO2 emissions associated with aluminum production vary widely based on the fuel mix used for electricity generation in a given country or region (Figure 2). It should be noted that in our analysis we did take into account the captive power and hydro power used in aluminum industry in different countries.
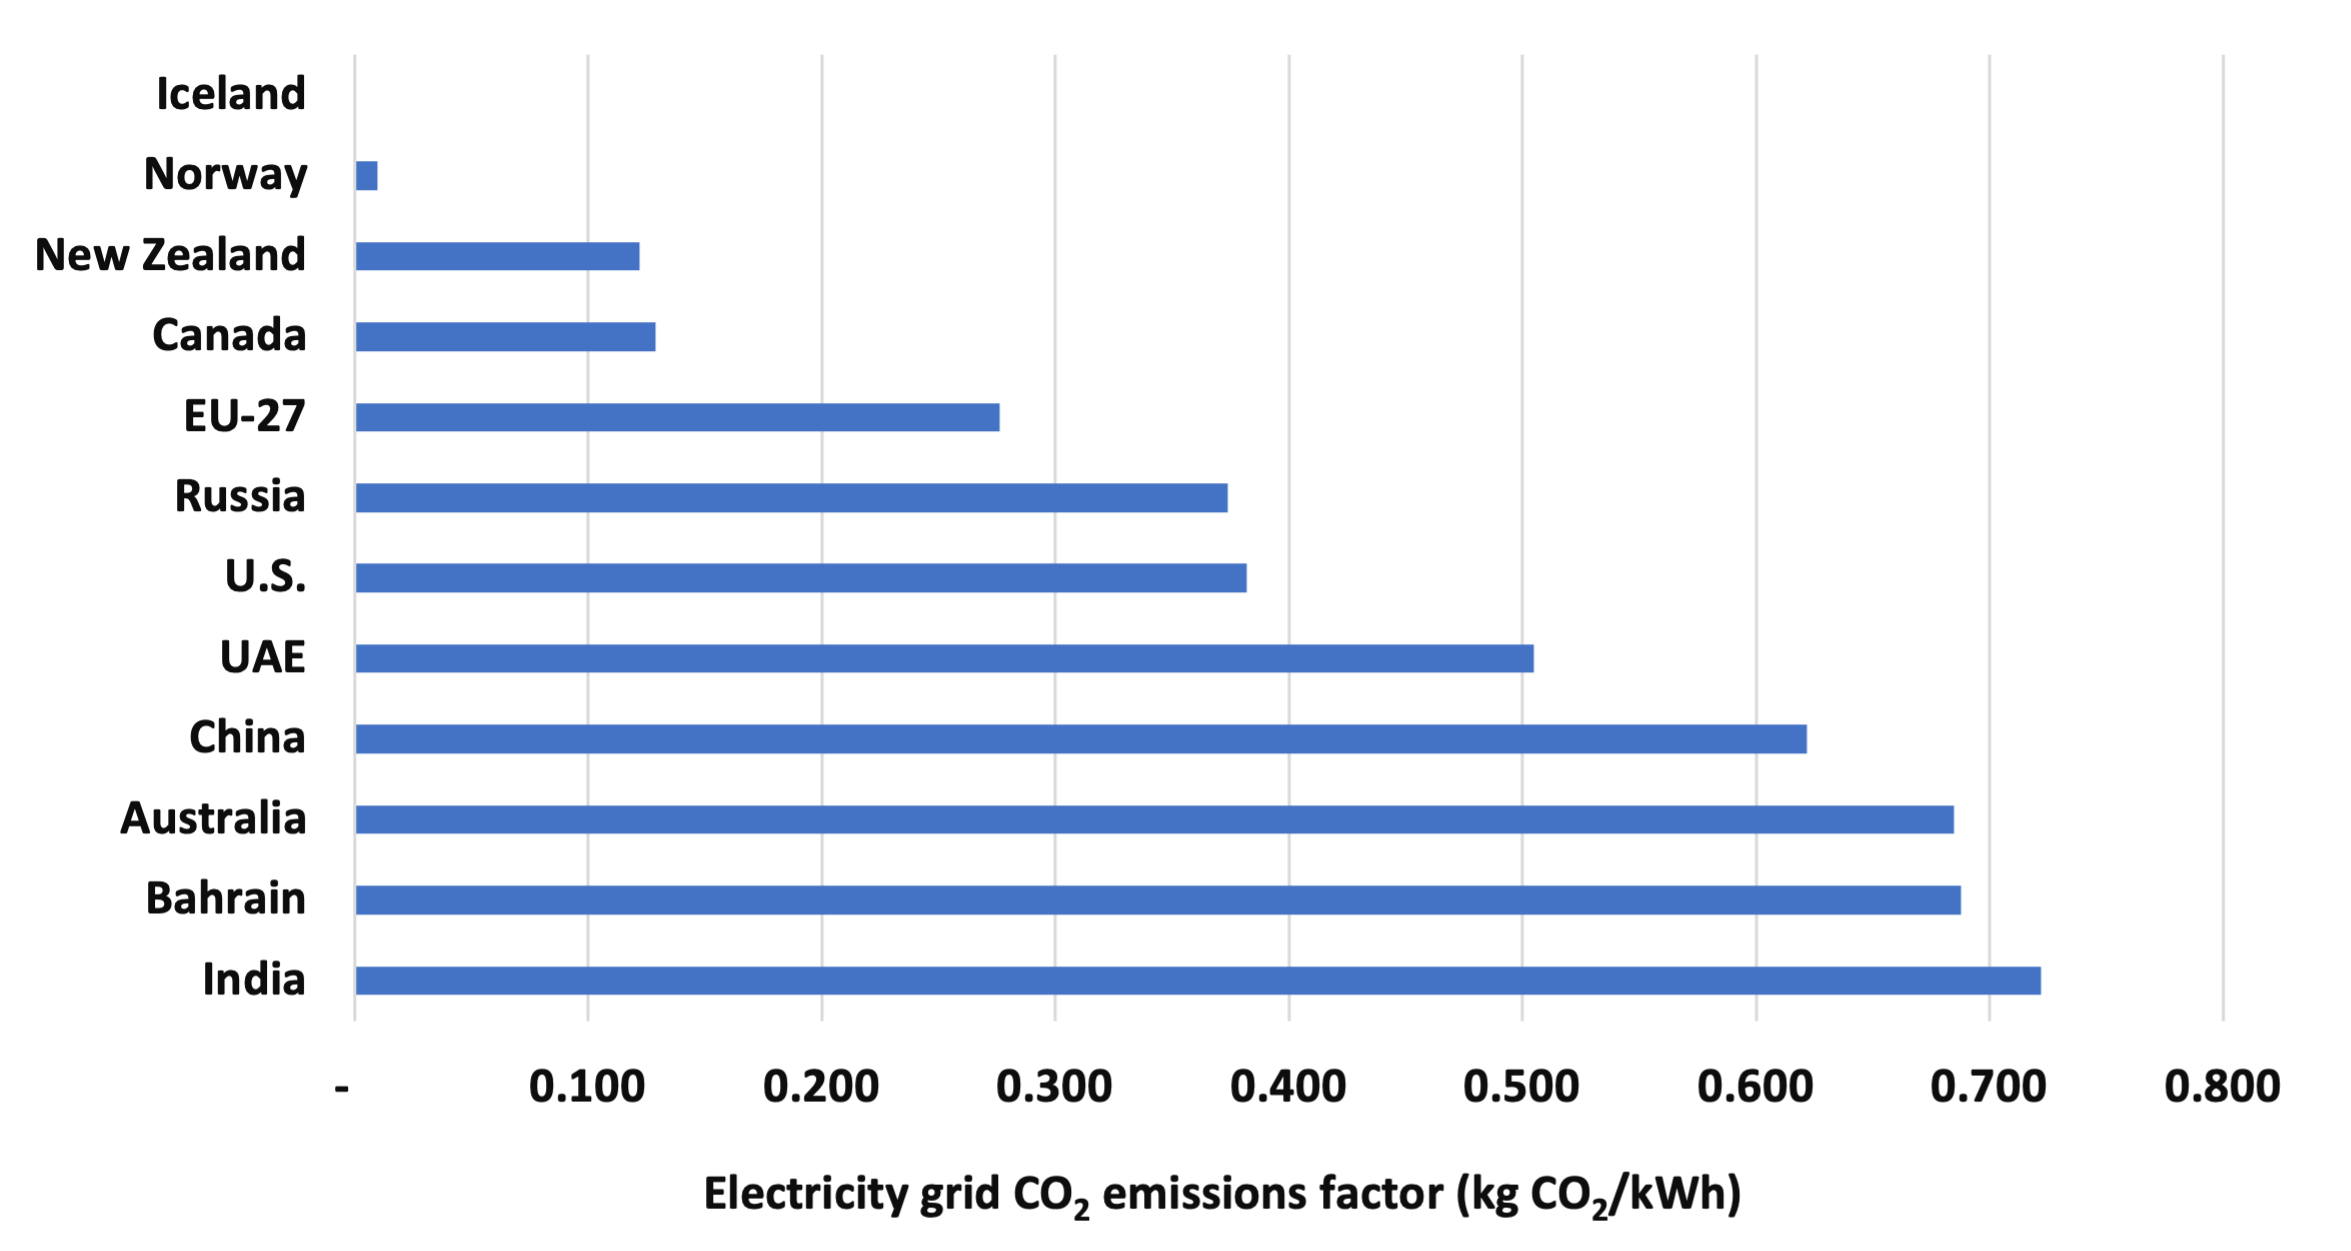
Figure 2. Electricity grid CO2 emissions factor the countries/regions studied
The following factors can influence the primary aluminum production’s energy and CO2 emissions intensity values across countries:
• The fuel mix used for alumina production
• The electricity grid CO2 emissions factor
• The source of alumina used for aluminum production
• The share and type of captive power used for aluminum production
• The level of penetration of energy-efficient technologies
• The aluminum product mix in each country
• The age of aluminum manufacturing facilities in each country
• Environmental regulations
• Cost and quality inputs
• Boundary definition for the aluminum industry
To read the full report and see complete results and analysis of this new study, Download the full report from this link.
Don't forget to Follow us on LinkedIn , Facebook and Twitter to get the latest about our new blog posts, projects, and publications.