Author: Ali Hasanbeigi, Ph.D.

According to the International Energy Agency (IEA), electric motor systems consume more than half of global electricity. Industrial electric motor systems account for over 70% of total global industrial electricity usage. Electric motors operate fans; pumps; and materials-handling, compressed-air, and processing equipment.
Because motor efficiency improvements will only marginally increase the motor system’s efficiency, we must look to improve the efficiency of the equipment and systems being driven by the motor. Optimization measures such as predictive maintenance, avoiding oversized motors, and matching motor systems to specific needs, etc. could improve the energy efficiency of motor-driven systems significantly. Even more savings can be achieved by looking not only beyond the motor to the whole motor system but beyond the system to the end-use device, as shown in Figure below.
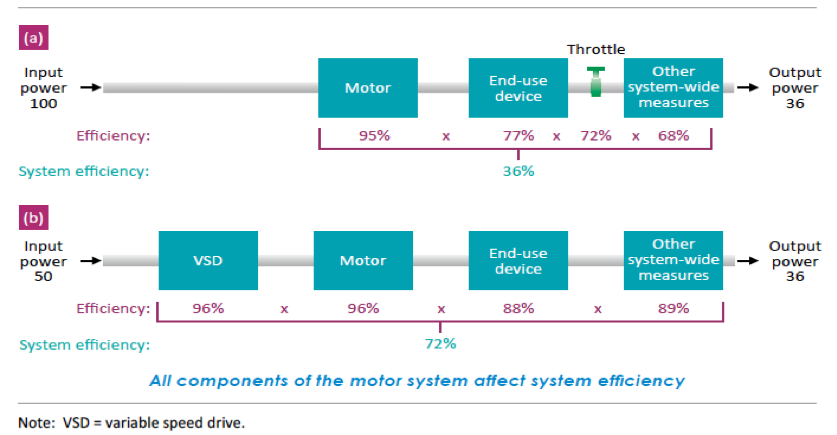
Figure. Illustration of two industrial electric motor-driven systems: (a) normal and (b) efficient (IEA 2016)
The traditional approach in most states and countries has been to focus on motors only and not on entire motor systems. As shown above, while increasing motor efficiency saves energy, optimizing the entire pump system will save much more energy. There is a need to shift the paradigm to focus on systems rather than individual motor efficiency. Programs and policies that target systems can save more energy and CO2 emissions in a more cost-effective manner than programs that focus only on motors.
Many utilities in the U.S. and governments around the world give substantial rebate for replacing electric motors with more efficient ones. While this may sound like a good thing to do, our extensive studies for 30 states in the U.S. and over 10 countries around the world shows that it is a clear waste of money. Why? Because in most cases, replacing existing motor with a more efficient one can improve the entire system efficiency by 1% - 5% (depending on the baseline efficiency of the systems). On the other hand, there are many other systems efficiency/optimization measures that can result in up to 20% - 25% efficiency improvement in the system.

For example, in a pump system with a Low efficiency baseline, replacing motor can only improve system efficiency by 5%, while trimming or changing impeller to match output to requirements can save about 15%, removing sediment/scale buildup from piping can save about 10% and installing variable speed drive (VSD) can save about 25% of the electricity use.
There is another very important reason why giving rebate for replacing motors with more efficient ones is such a waste of money in a massive scale. Our analysis consistently showed that replacing motor with more efficient one is by far one of the least cost-effective efficiency measures that can be implement on a motor system (for example in a pump systems or a fan systems). In other words, it cost much higher to save a kWh of electricity by replacing motor than to implement other system efficiency/optimization measures.
So, you might ask why many utilities and government prioritize giving rebate for replacing motors? The answer is it’s easier to implement and measure the saving. Utilities and government staff and program managers often need to show the amount of electricity saved as a result of implementing a rebate program. This is easier to do with equipment replacement than with soft measures such as system optimization. Having this said, many of the system optimization measures are easy to implement by in-house staff in the facilities.
To sum up, our detailed and extensive studies for three major industrial motor systems (pump systems, fan systems, and compressor systems) shows that millions of dollars spent annually by utilities and governments on rebate program for replacing electric motors with more efficient one is clearly waste of public and private funding. The better way would be to provide rebate for system efficiency measures that can save sometime up to 10 times higher energy saving with lower cost.
If utilities and governments persist to keep their motor replacement rebate program, my suggestion to them, based on the findings of our reports, is to bundle one or two efficiency measures with the motor replacement rebate. In other words, for an applicant to quality for motor replacement rebate, they should also implement one or two other system optimization measures from a list of measures that is predefined by utilities or government agencies.
To find out more about our detailed bottom-up studies for energy efficiency in industrial motor systems in the U.S., see our reports:
U.S. Industrial Motor Systems Energy Efficiency Reports Covering 30 States >>
Don't forget to Follow us on LinkedIn and Facebook to get the latest about our new blog posts, projects, and publications.
References:
IEA. 2016. World Energy Outlook 2016. Paris, France.
IEA, 2011. Energy efficiency policy opportunities for electric motor driven systems. Paris, France.