Aluminum Climate Impact 2025
An International Benchmarking of Energy and CO2 Intensities
Authors: Ali Hasanbeigi and Cecilia Springer
The global aluminum industry is responsible for about 2% of total carbon dioxide (CO₂) emissions worldwide. Between 2000 and 2024, global aluminum production more than doubled, driven largely by China, which produced 59% of the world’s aluminum in 2024. Despite some improvements in energy and emissions intensity, overall energy use and GHG emissions from the industry continue to rise. This is mainly because growing demand, especially in developing countries, is outpacing the modest efficiency gains being made under current technologies and policies.
In this study, we carried out a benchmarking analysis of energy use and CO₂ emissions intensity in the aluminum industry across the world’s top aluminum-producing countries. Our evaluation of primary aluminum production includes emissions from four main sources: electricity used in electrolysis, fuels used in alumina refining, process emissions from anode consumption, and perfluorocarbon (PFC) emissions resulting from anode effects. To provide clearer insight into emissions by production stage, we separately benchmarked energy consumption and CO₂ intensity for both alumina refining and aluminum smelting. In cases where countries import alumina rather than producing it domestically, we adjusted the energy intensity figures to reflect the upstream embodied energy of those imports. It should be noted that, for the primary aluminum production, we focus on emissions from alumina refining and aluminum smelting, and we do not include emissions from upstream bauxite mining or downstream alloying and metalworking processes.
Figure ES1 shows the CO2 emissions intensities for primary aluminum production in the countries/regions studied. Our results show that India, China, and Saudi Arabia have the highest, and Iceland, Canada, and Brazil have the lowest CO2 emissions intensities for primary aluminum production. Among several reasons, this is primarily because of the emissions factors of electricity used to produce aluminum in these countries (mainly in the electrolysis process).
The energy and CO₂ emissions intensity of primary aluminum production is shaped by a range of technical, operational, and policy factors. These include carbon intensity of electricity, use of captive power, fuel mix for alumina production, and upstream inputs like imported alumina. Other important factors are anode type, PFC control systems, electrolyte chemistry, plant efficiency, load factor, and facility age. National policies, product mix, and how countries define system boundaries in their reporting also play a role. Together, these factors explain why the CO2 intensity of primary aluminum production varies across countries.
Figure ES1: Total CO2 emissions intensity of primary aluminum production in 2023 (Source: This study)
In addition to primary aluminum production, we also assessed the CO₂ intensity of secondary aluminum production, which is 90%-95% lower than that of primary production. By using a weighted average of primary and secondary aluminum production based on each country’s production mix, we calculated the overall aluminum sector CO₂ intensity (primary + secondary) in each country. Countries with a high share of secondary aluminum, like the EU27 and the U.S., show much lower overall CO2 emissions intensity for the aluminum industry, while those heavily reliant on coal-powered primary aluminum production and with limited recycling, like India and China, have the highest overall CO₂ intensity (Figure ES2).
Figure ES2: Overall aluminum sector CO₂ intensity (primary + secondary) in 2023 (weighted average of CO2 intensity of primary and secondary aluminum production) (Source: This study)
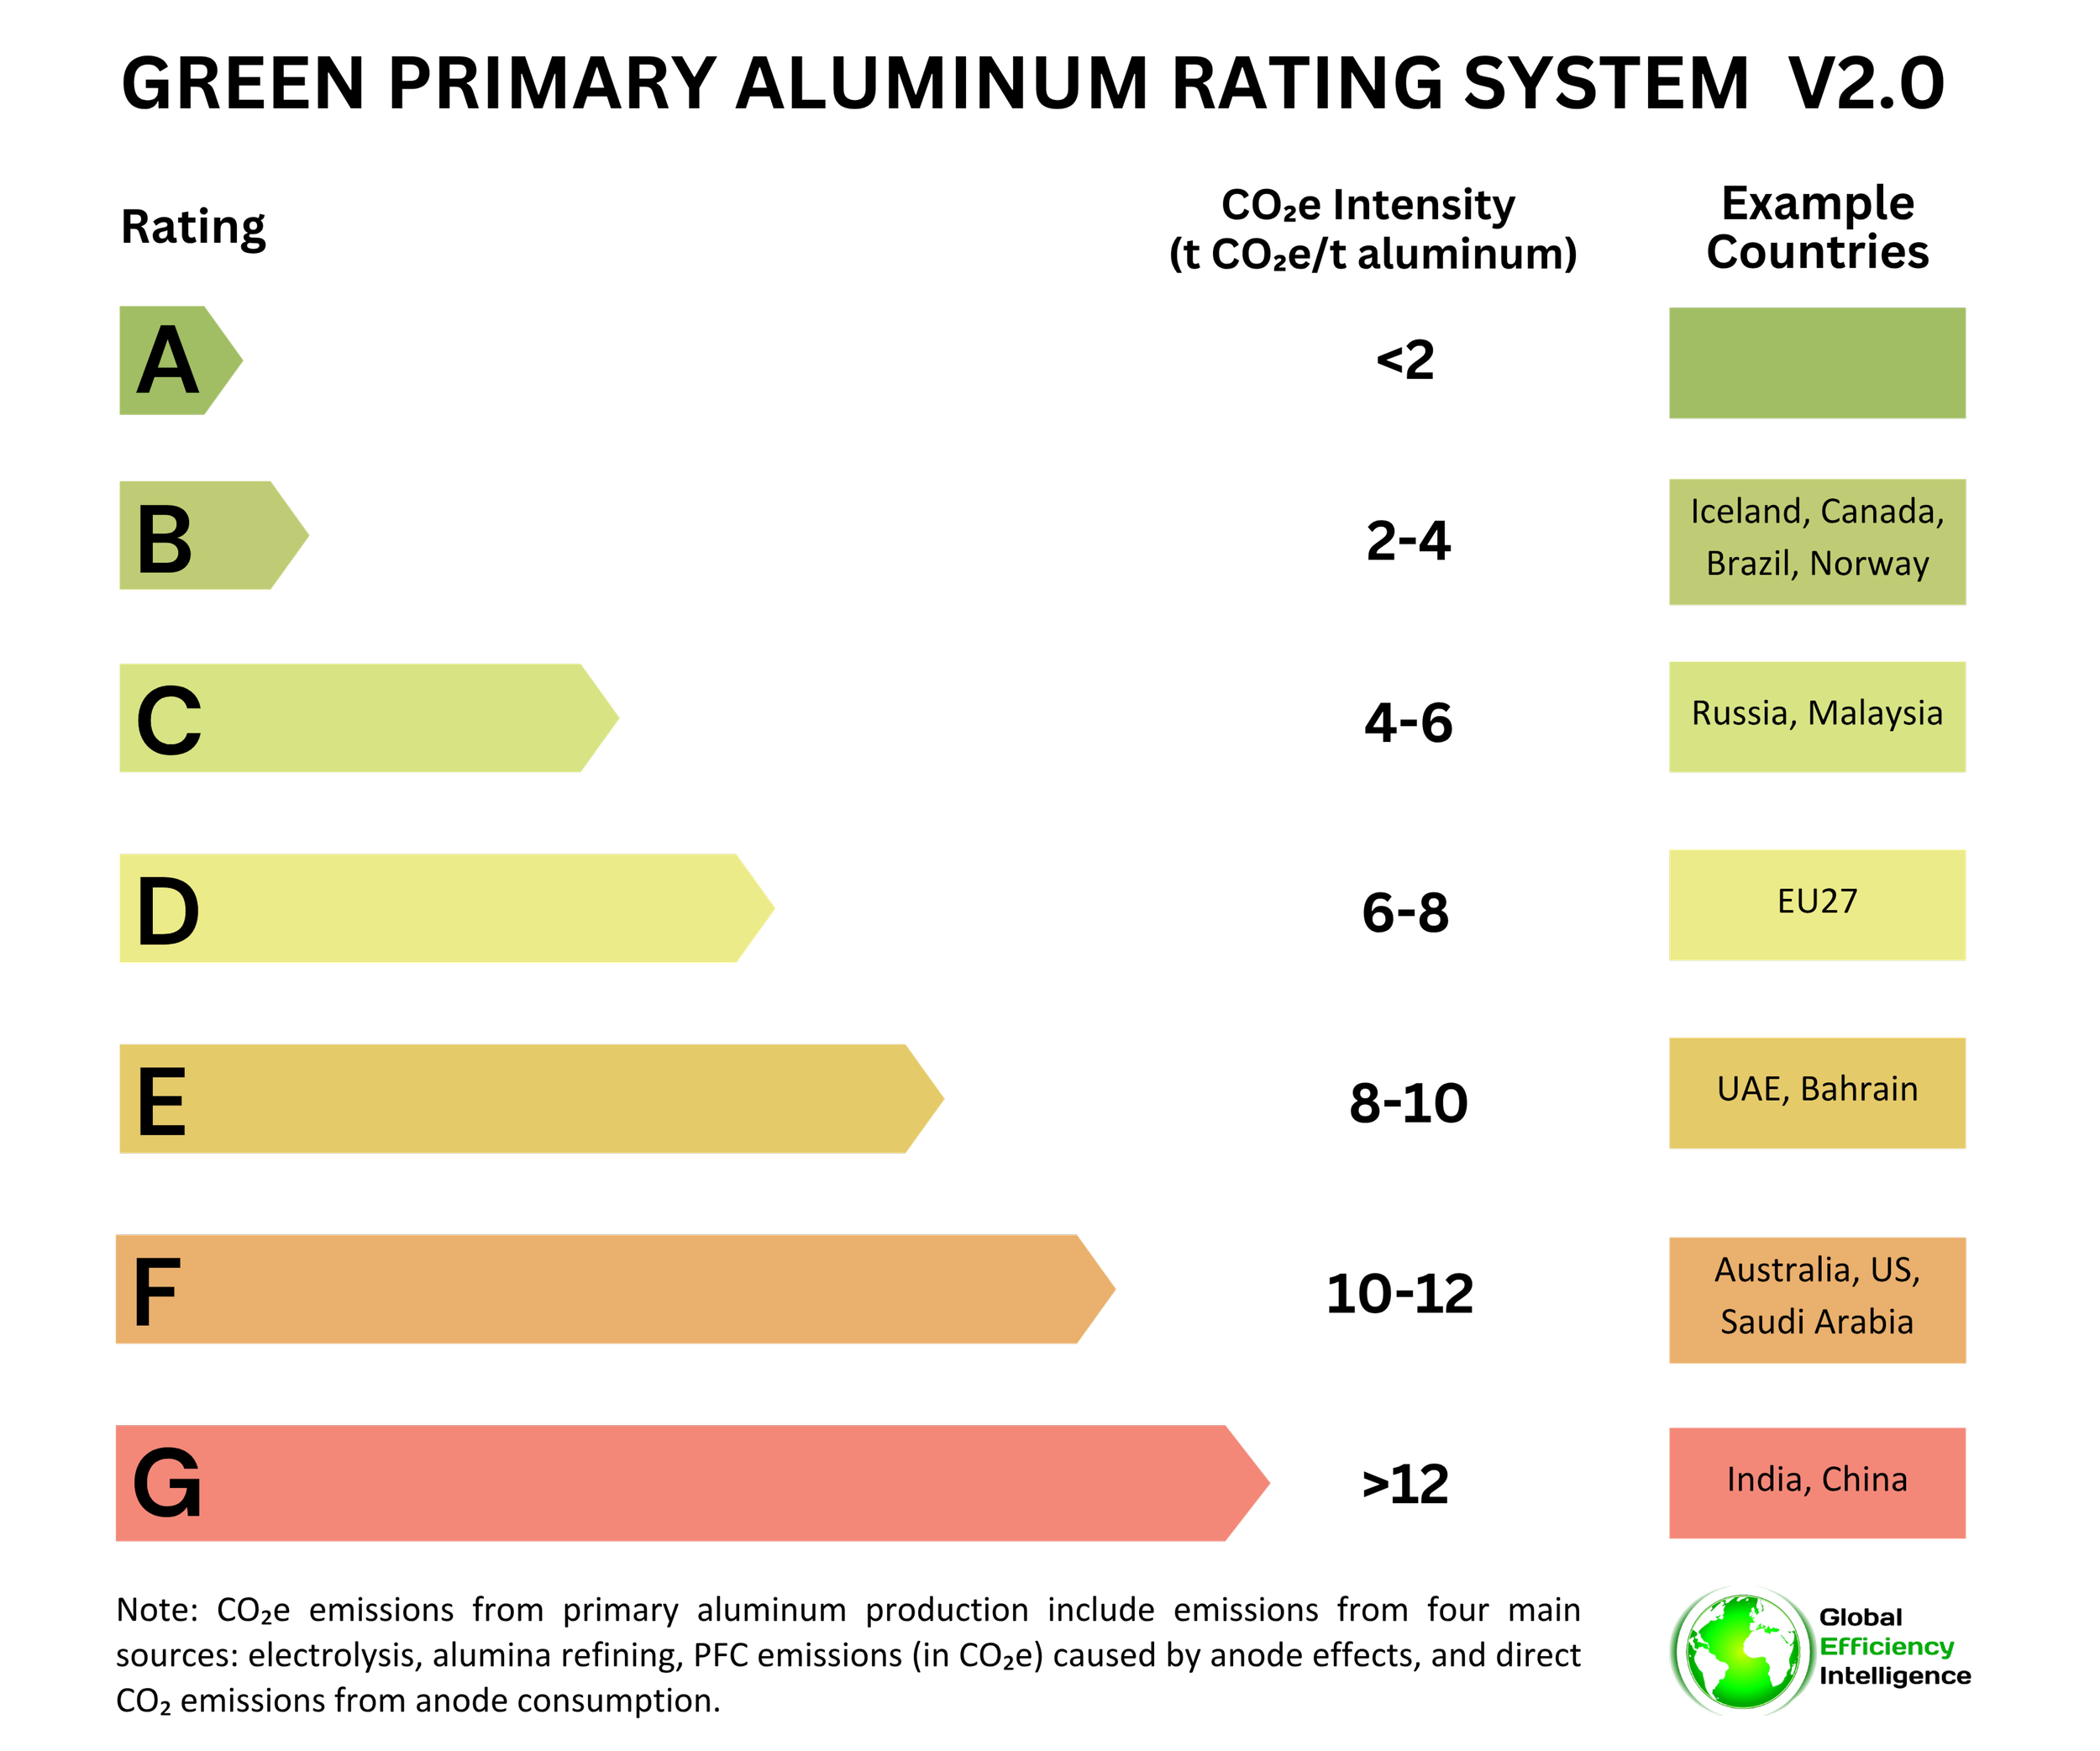
To improve transparency and drive decarbonization, we developed the Green Primary Aluminum Rating System v2.0, which is a CO₂-based framework that assigns ratings from A to G based on the emissions intensity of primary aluminum production. This rating system is designed to guide policy development, inform procurement decisions, and support responsible sourcing by governments, companies, and end-users. No country meets the A rating level yet (under 2 tCO₂/t Aluminum) (Figure ES3).
Figure ES3. Green Primary Aluminum Rating System v2.0 (Source: GEI analysis)
As global aluminum production continues to grow, especially in developing economies, cutting this sector’s CO₂ emissions will require more than incremental efficiency gains. Deeper decarbonization will depend on the adoption of new technologies, alternative processes, and cleaner power sources. Given that electricity used in electrolysis accounts for the vast majority of emissions in primary aluminum production, decarbonizing the electricity supply is the most critical step. This report provides a clear picture of current performance across major producing countries and identifies where the most urgent and impactful improvements can be made.
To read the full report and see complete results and analysis of this new study, download the full report from the link above.
Interested in data and decarbonization studies on the global steel industry? Check out our list of aluminum industry publications on this page.
Don't forget to follow us on LinkedIn and X to get the latest about our new blog posts, projects, and publications.


