
Targeting Precalciner Emissions for Deep Decarbonization of Cement Production in India
A Techno-Economic Assessment of Electrification and Carbon Capture Pathways
Authors: Ali Hasanbeigi, Pinchookorn Chobthiangtham, Hanjie Wang
Cement is one of the world’s most carbon-intensive industrial materials, accounting for more than 7 percent of global CO₂ emissions. Its decarbonization challenge is fundamentally different from that of most other heavy industries. In an average cement plant, roughly 60 percent of direct CO₂ comes from the chemical decomposition of limestone rather than from fuel combustion. This process CO₂ would still be released if the plant used no fossil fuel.
India is the world’s second-largest cement producer, produced about 484 million tonnes (Mt) of cement in 2025, and is adding capacity at scale every year. India’s cement production could rise roughly fourfold by 2070. Plants designed and built in India during the next two decades will therefore shape the sector’s emissions and technology options for much of the century. Making those plants capture- and electrification-ready at the design stage is the single most important near-term step, and it costs far less than retrofitting an operating plant built without those provisions.
In a cement plant, the precalciner is the main leverage point. It is where most limestone calcination occurs and where roughly 60 percent of the plant’s thermal energy is consumed. The preheater-precalciner system consequently accounts for about 80 percent of CO₂ emissions from process and combustion sources combined. Precalciner also operates at about 850°C to 900°C, far below the approximately 1,450°C required for clinker sintering in the kiln. This makes it more accessible to electric heating, indirect heat transfer, and concentrated-CO₂ capture concepts.
In this study, we compare a conventional new-build Indian dry-kiln pre-heater, precalciner plant with ten precalciner decarbonization configurations on one common techno-economic basis. The reference cement plant produces 3,000 tonnes of clinker per day. Seven configurations are deep-decarbonization routes, avoiding roughly half to four-fifths of the plant’s net CO₂, and form the main ranking of routes in our study. Three configurations are limited abatement measures: partial electric hot-gas heating, electric-assisted alternative-fuel calcination, and their commercial combination. These three limited-abatement configurations avoid only about 4 to 8 percent of plant CO₂ and are therefore discussed separately rather than ranked with the deep-decarbonization routes.
The deep-decarbonization routes span three overlapping technology families:
1. The first captures both combustion and process CO₂ from a combined flue-gas stream: whole-plant post-combustion capture with monoethanolamine (MEA), and separate-calciner oxyfuel with capture.
2. The second separates process CO₂ at the source by heating the calciner indirectly through a reactor wall, which we call direct separation: fuel-fired indirect calcination and a half-electric variant that uses electricity during low-cost renewable hours and fuel otherwise.
3. The third electrifies calciner heat, fully or in part, and pairs it with capture or direct separation: electric indirect calcination, electric arc or plasma calcination, and a partially electrified hot-gas calciner (about 31 percent of calciner heat) combined with whole-stack MEA capture.
All configurations are evaluated over 30 full operating years from 2035 through 2064, in 2025 real US$, using the same plant boundary and other key assumptions.
Indirect calcination with capture is the lowest-cost deep-decarbonization route in the base case, at about $65 per tonne of CO₂ avoided. Its half-electric variant follows at about $70, and separate-calciner oxyfuel is effectively tied with it at about $71. These three routes form the leading technology routes. Whole-plant MEA capture, the mature benchmark, costs about $95 per tonne of CO₂ avoided. Electric hot-gas heating combined with whole-stack MEA, at about $99, and electric indirect calcination, at about $100, are effectively tied with it on this screening metric, although a discounted comparison in Chapter 3 separates the three. Electric arc or plasma calcination is higher at about $116 (Figure ES-1).
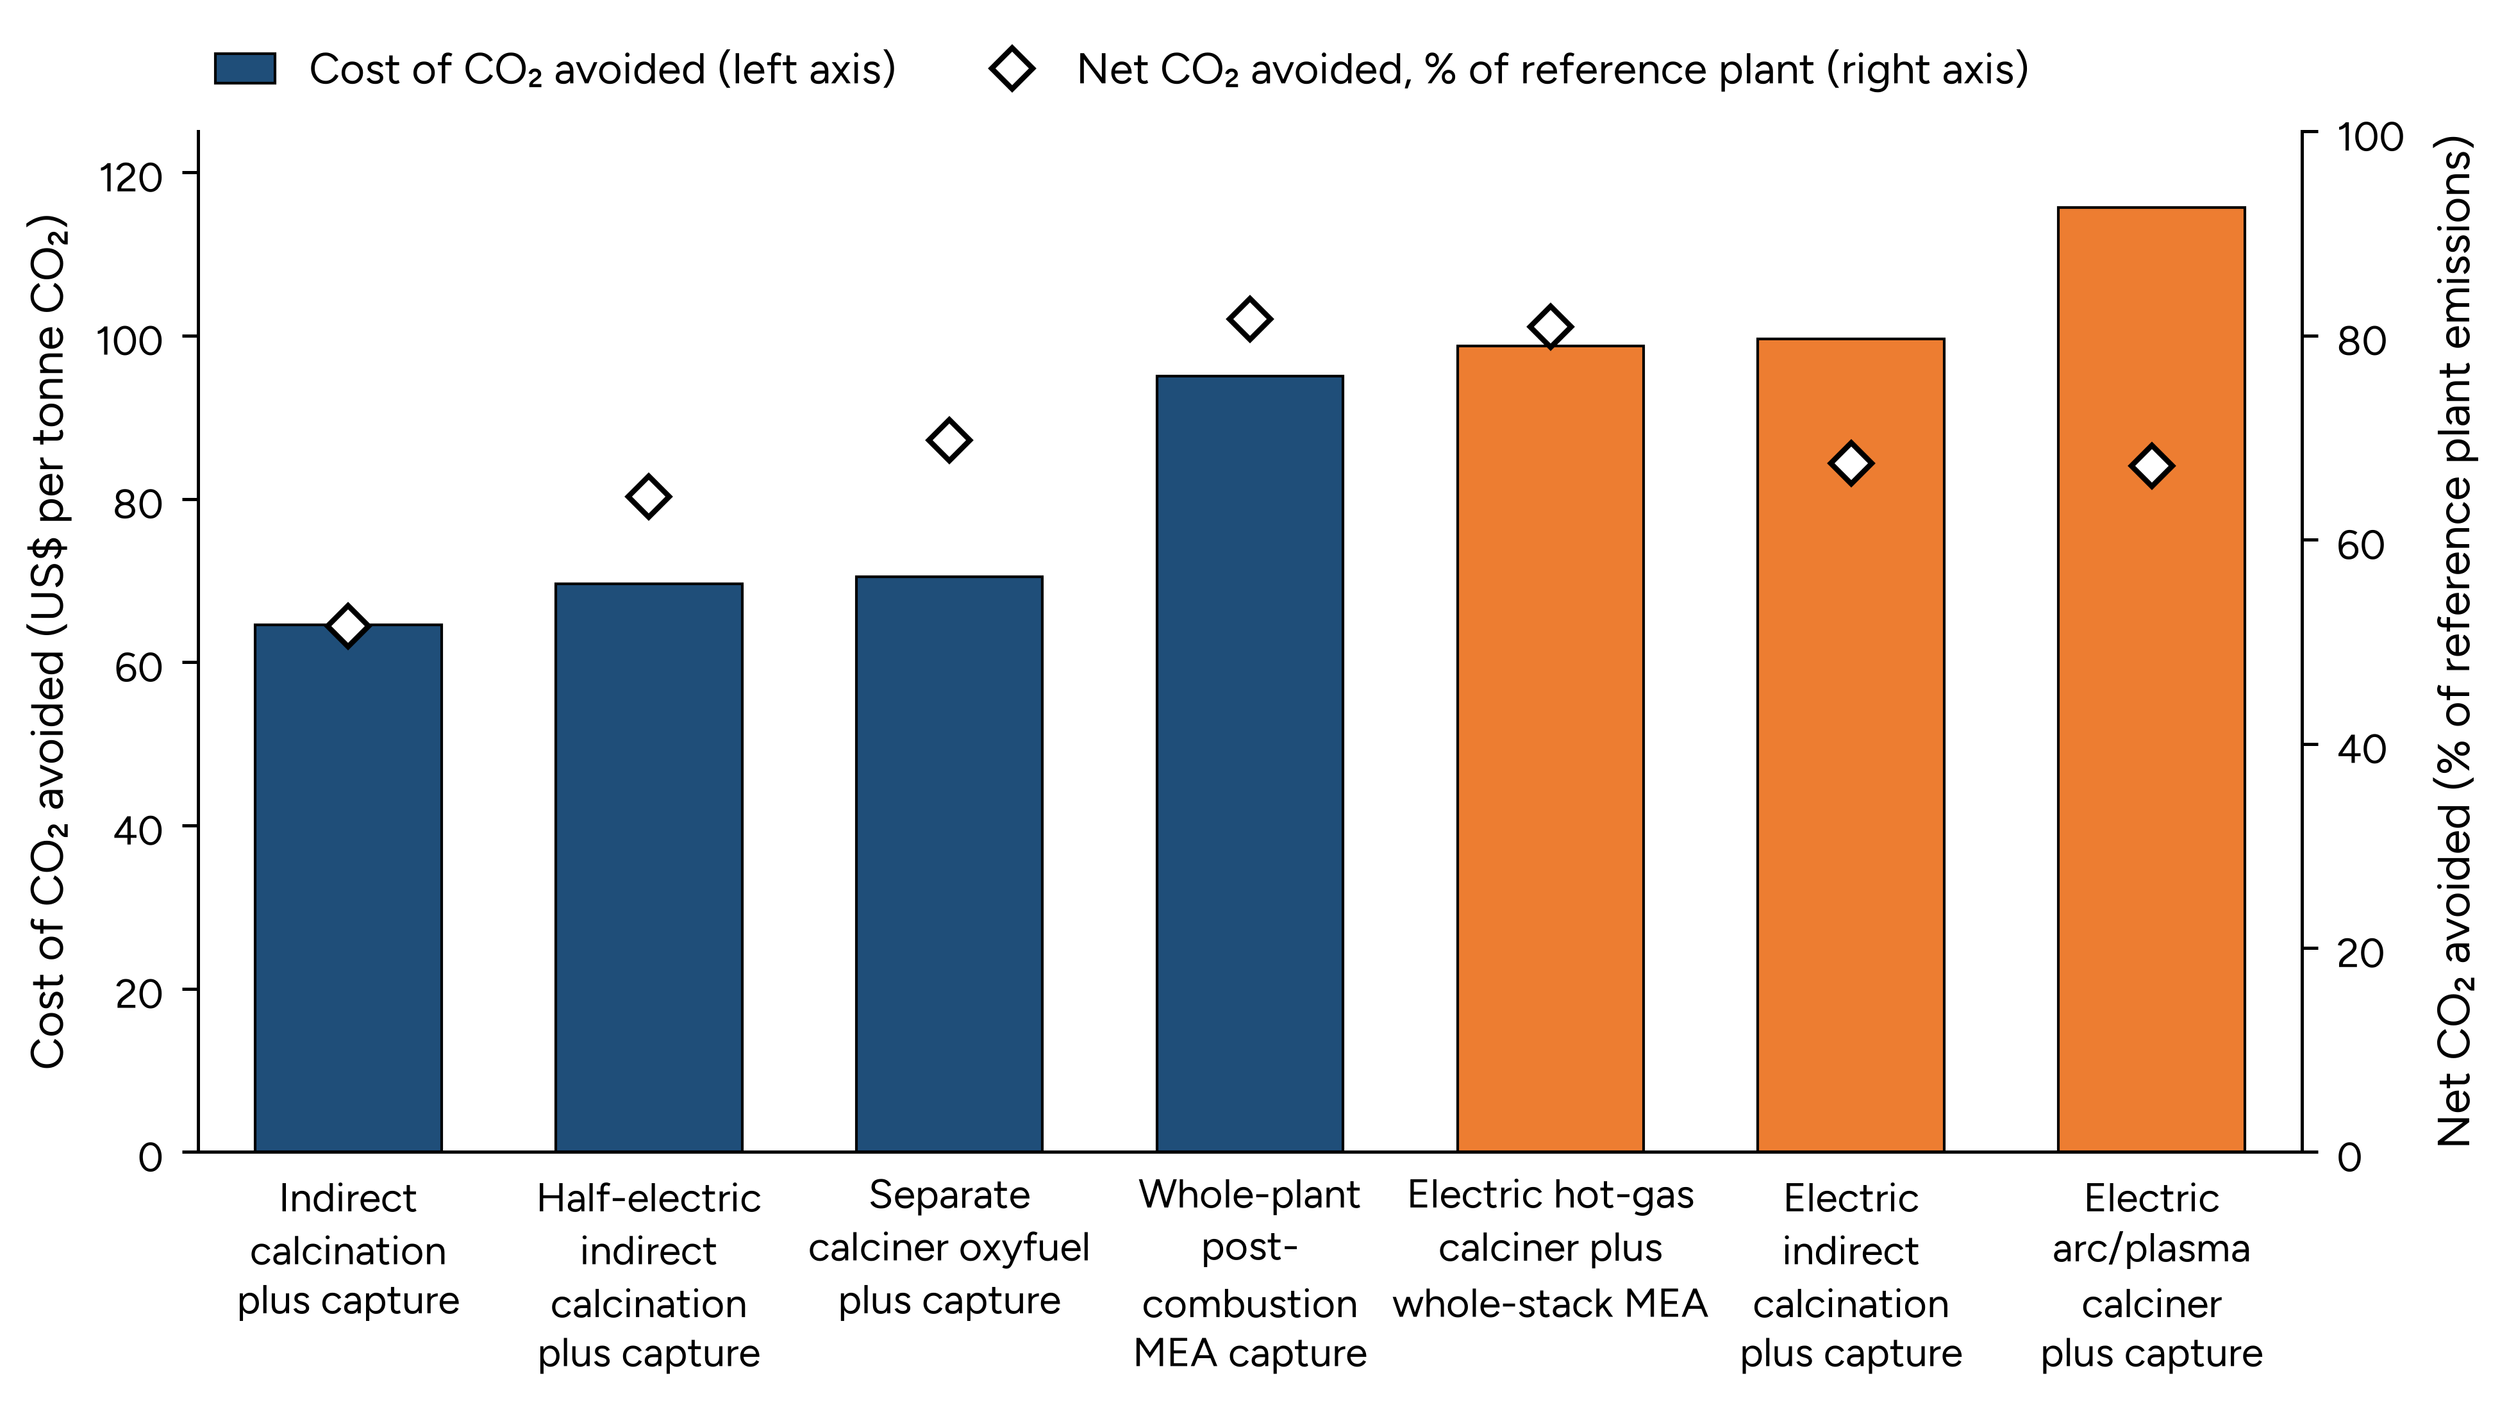
Figure ES-1. Cost of CO₂ avoided by technology route in India (2025 US$ per tonne CO₂, bars, left axis) and the share of the reference plant’s net CO₂ avoided (markers, right axis), for the 3,000 tonnes clinker per day reference cement plant. The seven deep-decarbonization routes are shown; the three limited-abatement configurations are discussed in the text.
The ranking shows what each route must pay for to abate a tonne of CO₂. The leading technology routes primarily pay for capture or separation equipment, financing, and CO₂ transport and storage. The fully electric routes pay for those requirements and for replacing low-cost coal/petcoke heat with continuous electricity, including the cost of firming renewable supply. This produces a clear cost premium for full electrification in the base case. The fully electric routes also add roughly 90 MW of continuous load, and the half-electric route adds about 86 MW at peak (a total plant draw of roughly 100 MW), so the grid connection is a project-critical element of every electric route. The overall spread remains less than a factor of two, however. India therefore has several technically distinct routes to deep precalciner decarbonization, and plant circumstances, infrastructure, and maturity can matter as much as the exact central cost ranking.
The half-electric route’s second-place position depends on the availability and cost of flexible renewable electricity and on sustained dual-heat operation. Two of the three lowest-cost routes share the same direct-separation reactor. This means that one successful commercial project can de-risk both the fuel-fired and half-electric configurations for indirect calcination. The announced Leilac-Ambuja project in Gujarat, India is therefore particularly important. A calciner-scale oxyfuel demonstration is the corresponding priority for the third member of the leading technology routes.
The route with the lowest cost per tonne of CO₂ is not the route with the deepest CO₂ reduction. Indirect calcination avoids about 52 percent of the reference cement plant’s net CO₂ because it captures the calciner process stream while leaving kiln combustion emissions in place. The half-electric route avoids about 64 percent, and oxyfuel about 70 percent. Whole-plant MEA reaches the combined kiln and calciner flue gas and avoids about 82 percent. The hot-gas + MEA route, whose whole-stack capture also treats the fuel that still fires most of the calciner, avoids about 81 percent, so the two whole-stack capture routes deliver the deepest reductions in our study. Electric indirect and electric arc or plasma calcination each avoid about 67 to 68 percent. Cost, abatement depth, technology maturity, and infrastructure requirements must therefore be considered together when looking at these routes.
The cost structure explains why different routes respond to different policies. Capture and direct-separation routes carry large capital and CO₂ transport-and-storage components, while their incremental electricity costs are comparatively small. Fully electric routes have a smaller storage block but a dominant electricity block. The half-electric route sits between the two: it retains the direct-separation storage requirement but buys electricity only in lower-cost renewable hours (Figure ES-2).
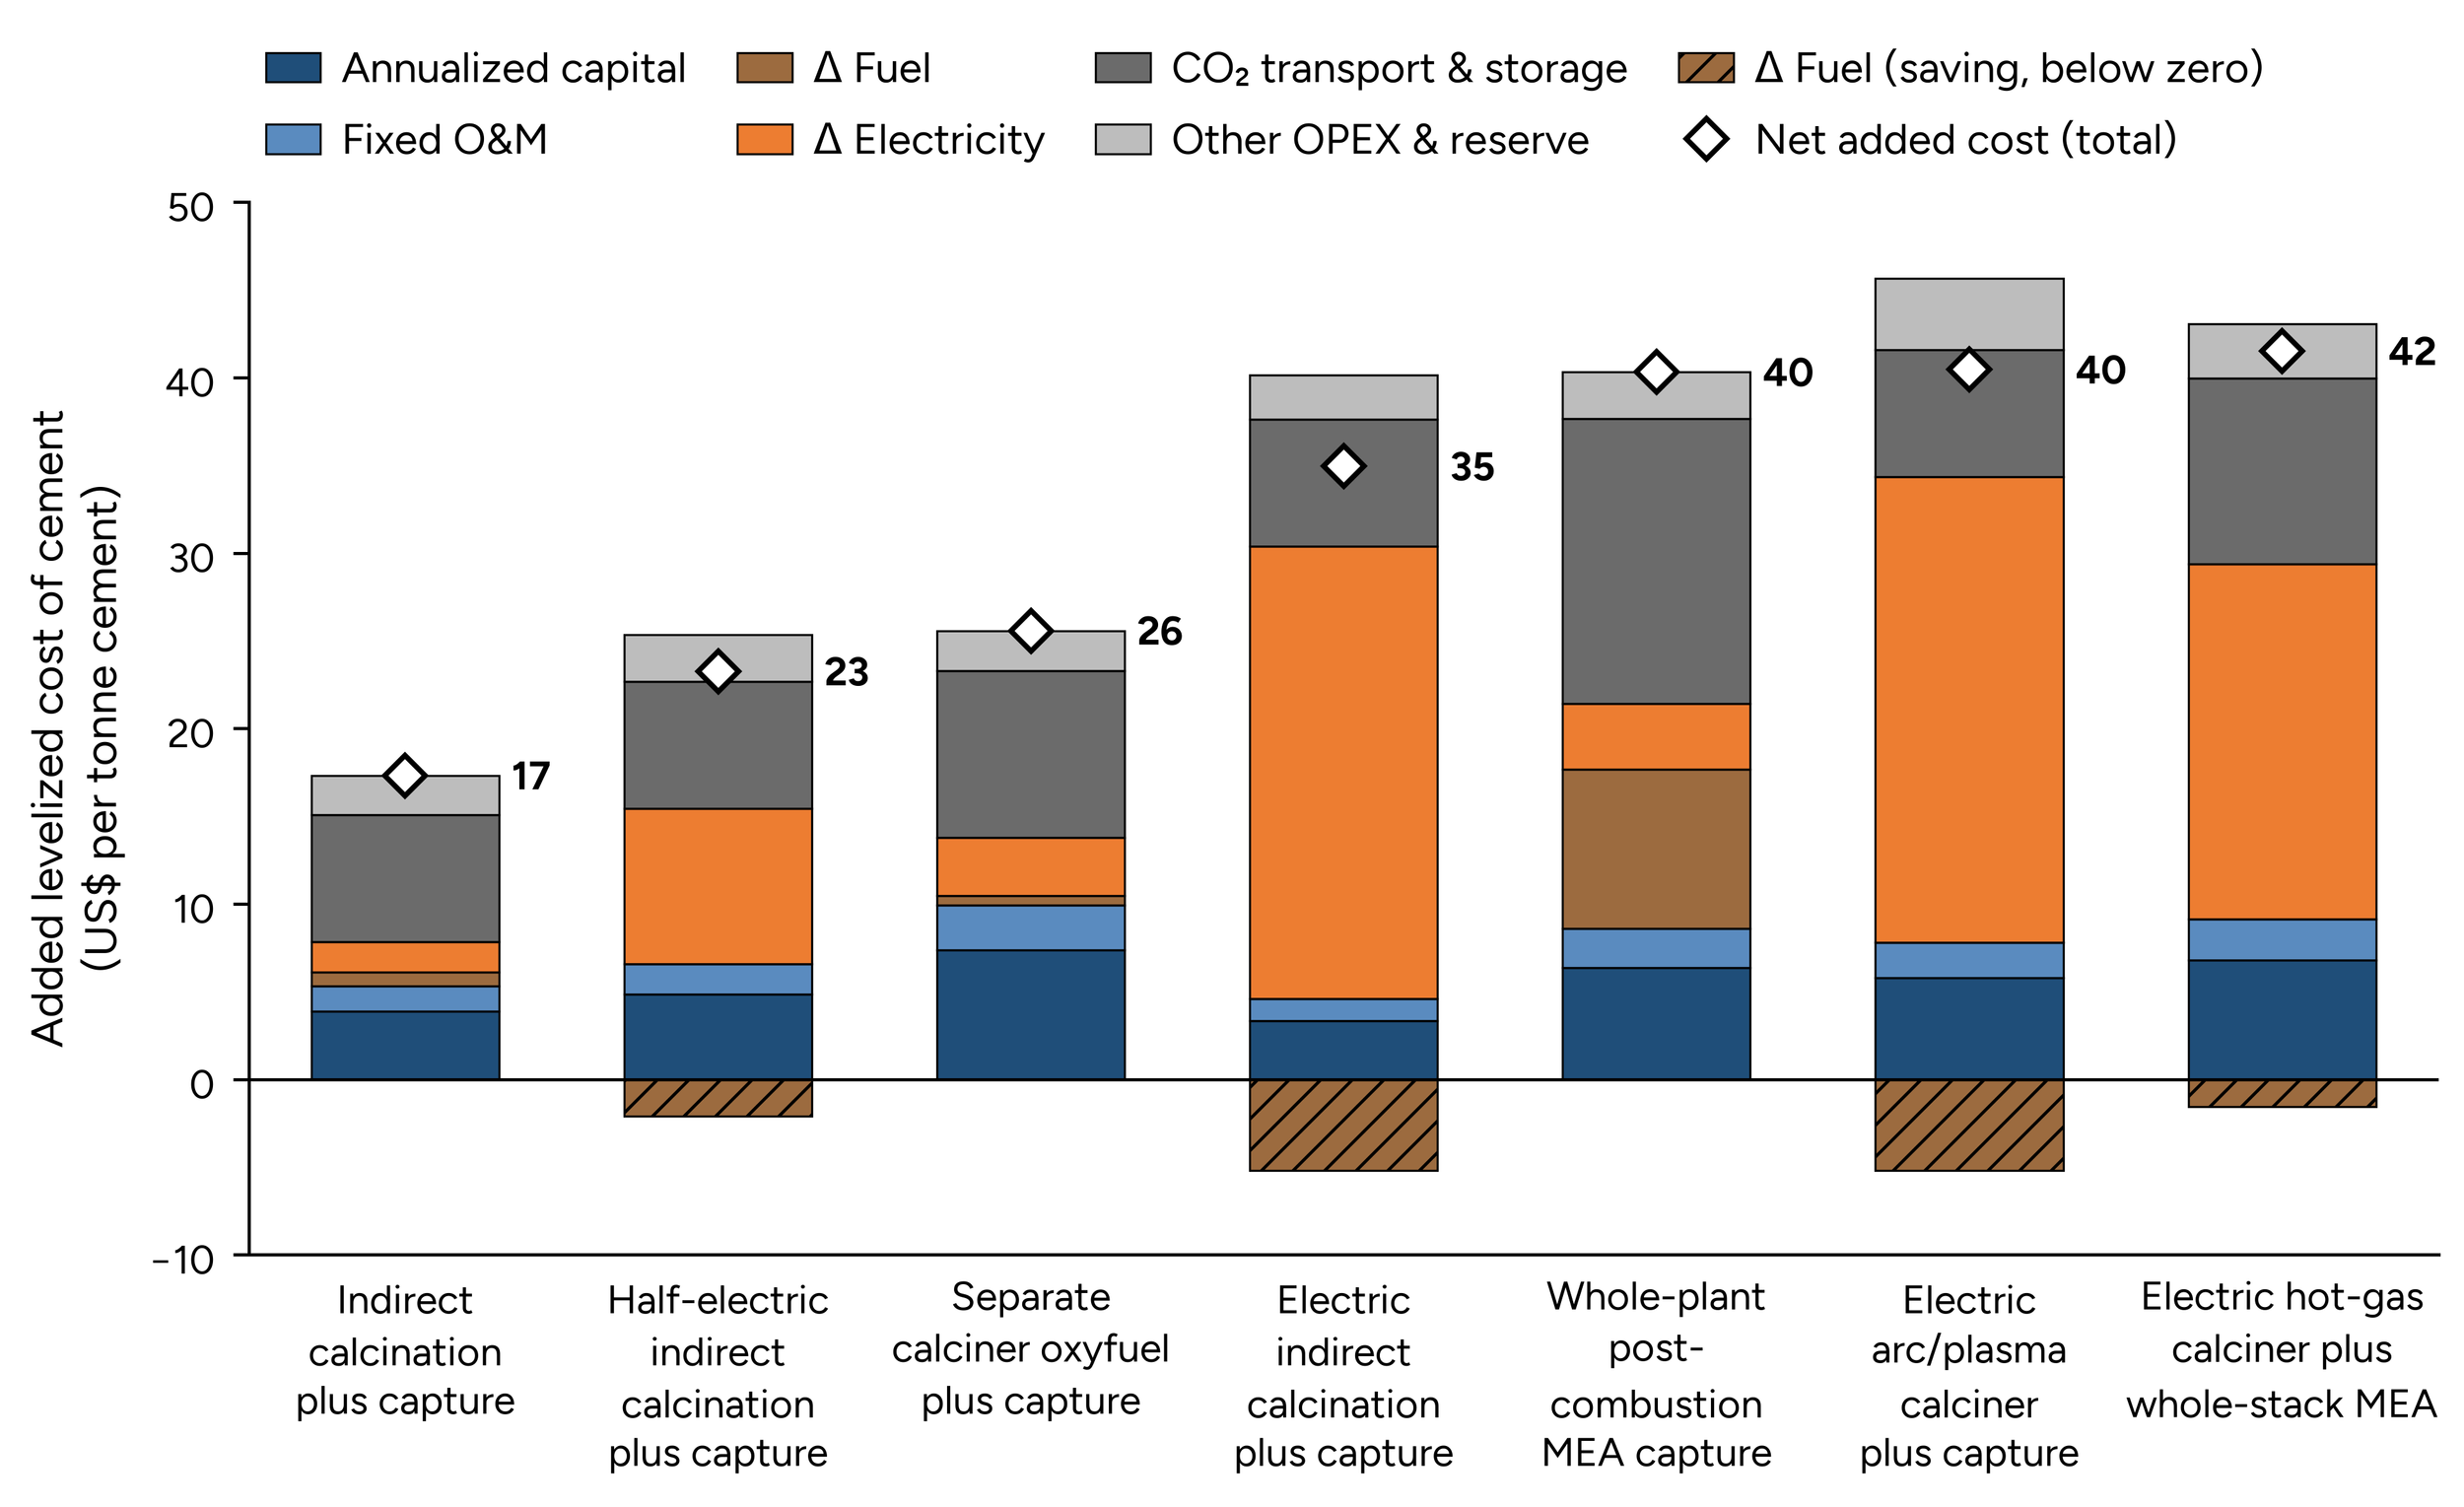
Figure ES-2. Build-up of the added levelized cost of cement by component in India (2025 US$ per tonne cement), for the 3,000 tonnes clinker per day reference cement plant. Fuel savings are shown below zero and the markers give the net added cement cost.
This difference in cost structure has a direct policy implication. Shared CO₂ infrastructure and lower-cost capital provide the greatest benefit to capture and separation routes. Affordable firm low-carbon electricity is the decisive lever for the fully electric routes. A generic support package that does not distinguish these cost structures will be less effective than one tailored to the binding constraint of each technology family. CO₂ transport and storage costs are the single largest common uncertainty. The base case assumes $25 per tonne of CO₂, an optimistic value for an Indian system that does not yet have a developed transport-and-storage network. Raising the CO₂ transport and storage cost to $55 moves the leading technology routes to about $96 to $102 per tonne of CO₂ avoided and narrows its advantage over the electric routes. For the capture routes, location relative to a viable storage site can therefore matter more than the difference among technologies within the leading technology routes.
On a cement basis, the three leading technology routes add about $17 to $26 per tonne of cement. Whole-plant MEA adds about $40, while the electric routes add about $35 to $42 per tonne of cement. These are cement plant-level costs, but they do not translate one-for-one into the cost of concrete or construction. The premium becomes progressively smaller as cement is combined with aggregates, labor, equipment, land, and other inputs further down the value chain.
A coordinated package of moderate interventions can lower the added cost materially. The package combines a capital grant, a lower cost of capital, cheaper CO₂ transport and storage, and cheaper renewable electricity, applied cumulatively. For the three leading technology routes, the added levelized cost of cement falls from about $17 to $26 per tonne to roughly $12 to $17. The leading fully electric route, electric indirect calcination, falls to about $27 per tonne (Figure ES-3).
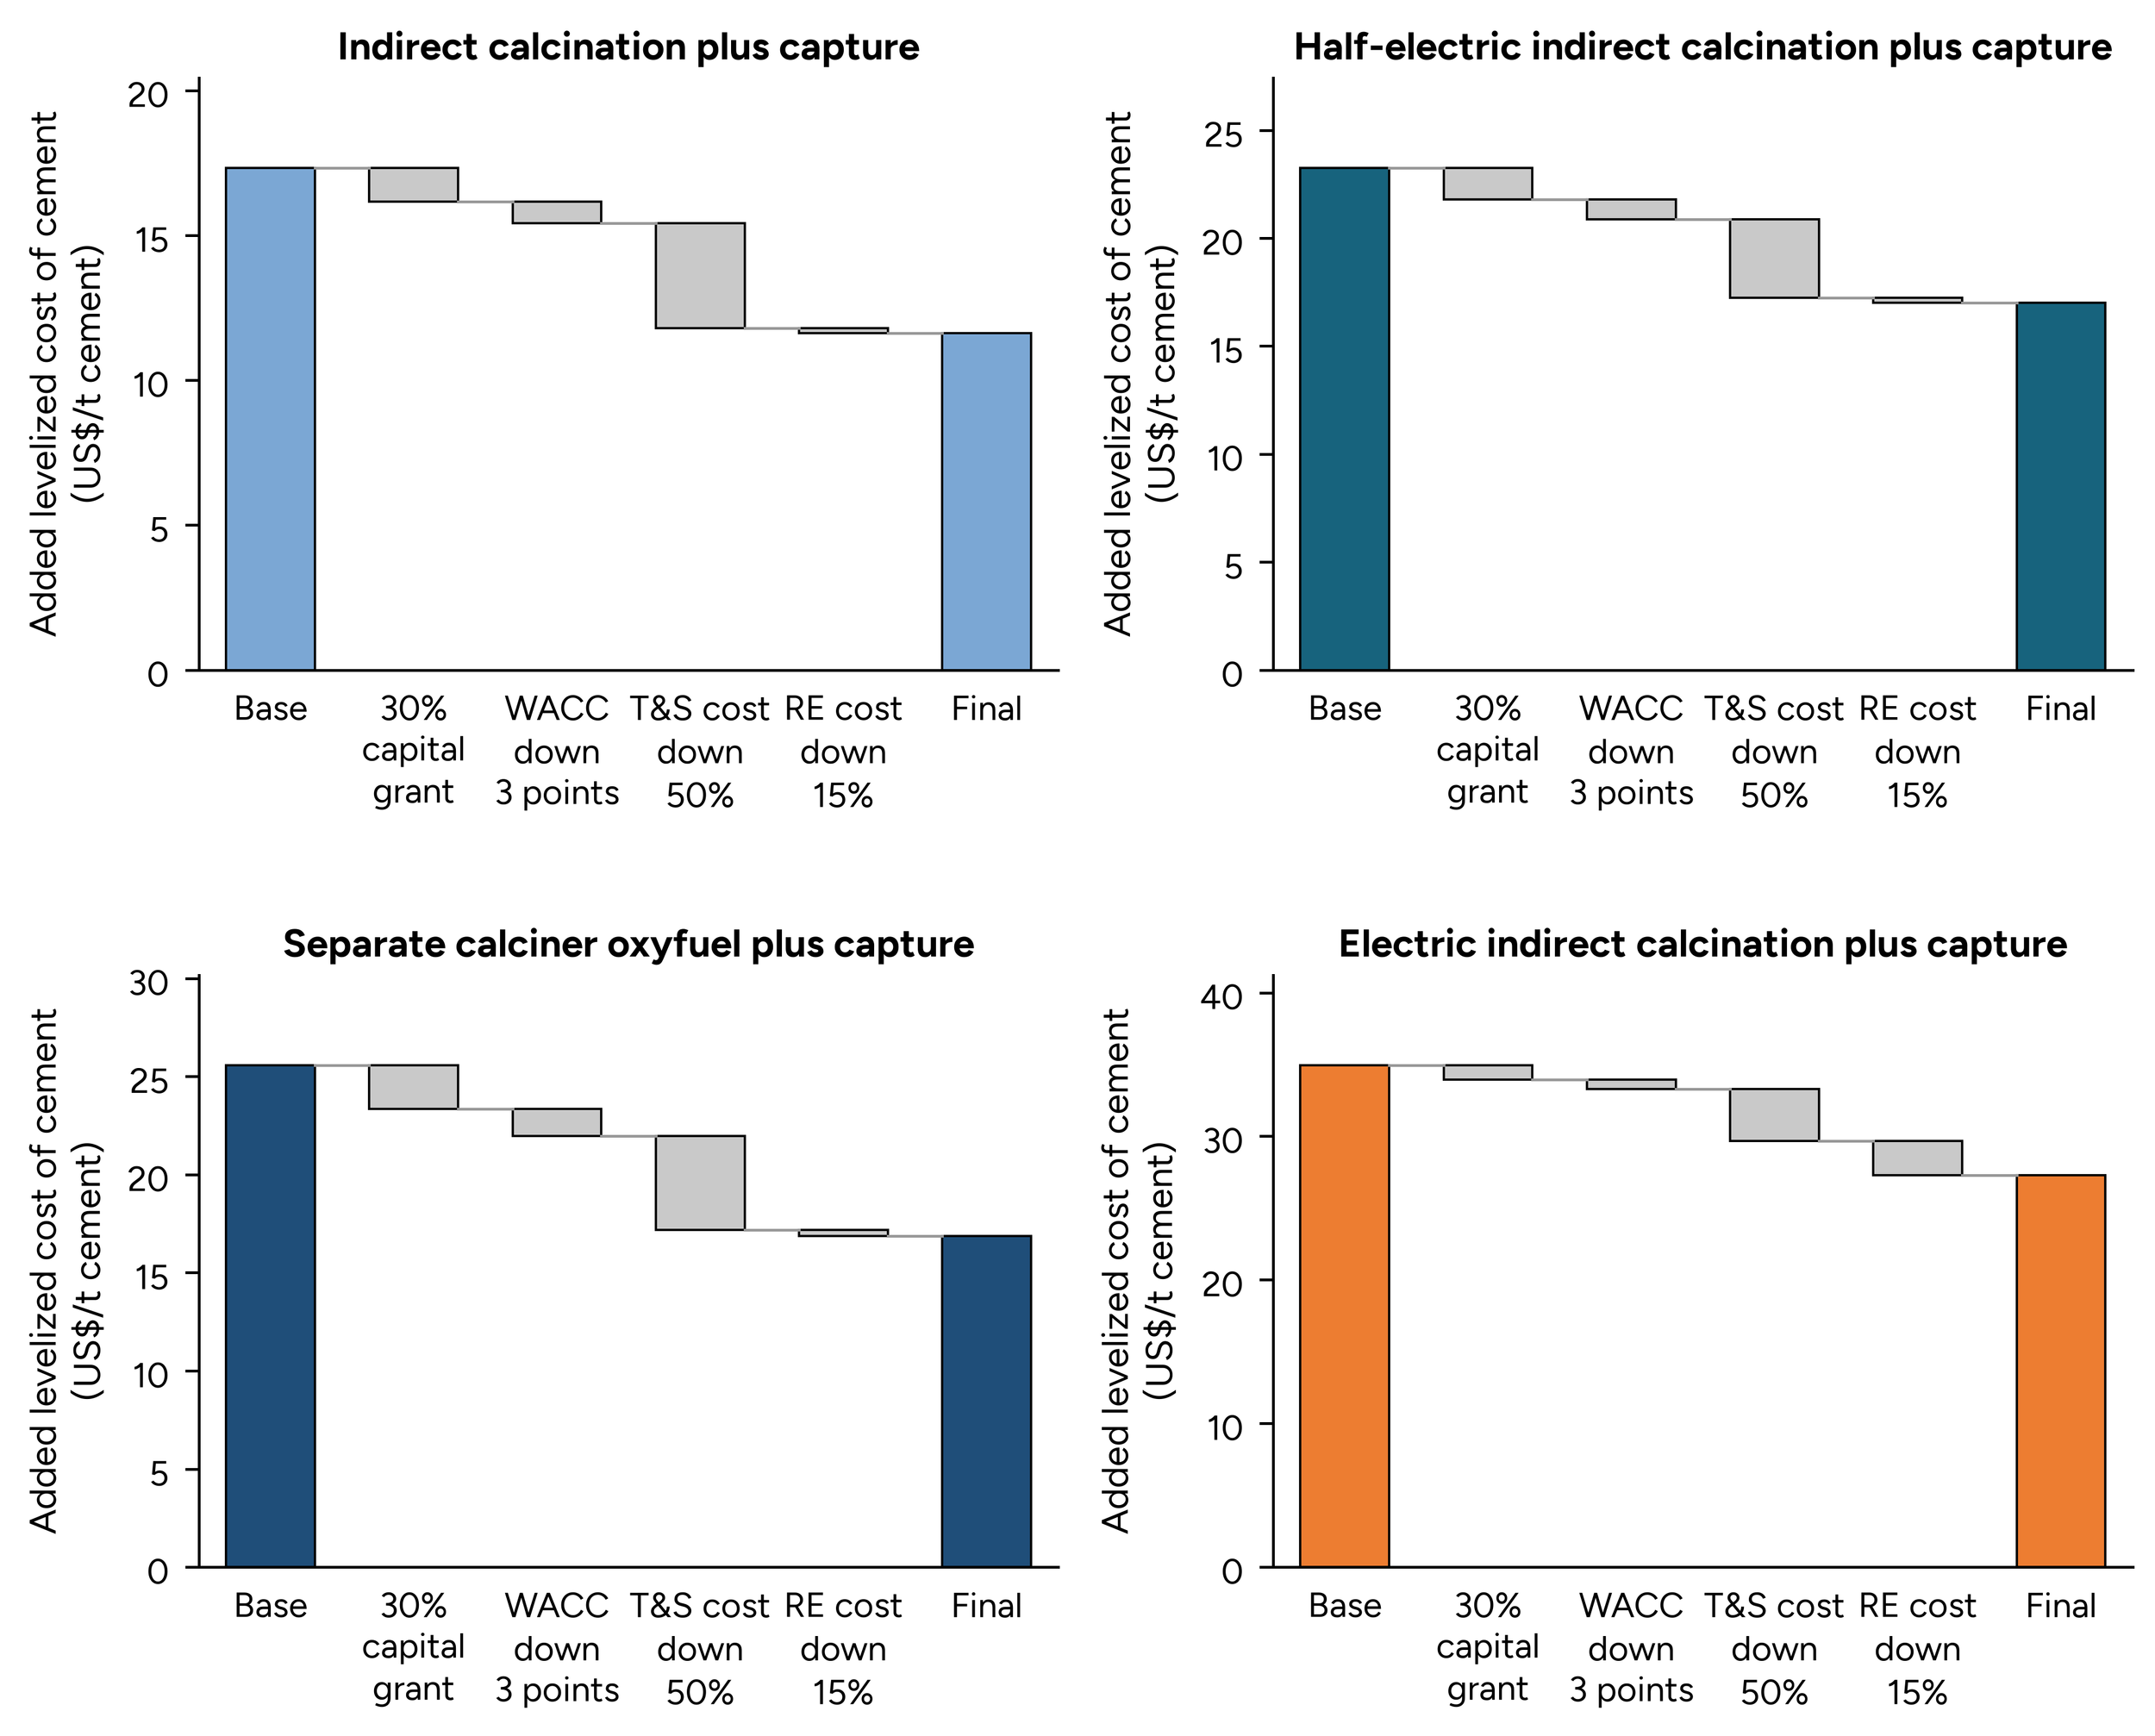
Figure ES-3. Effect of a coordinated support package on the added levelized cost of cement in India, for the three leading routes and the leading electric route (2025 US$ per tonne cement), for the reference cement plant.
No single support instrument closes the cost gap alone in any of the technology routes we assessed. The largest reductions come from cheaper CO₂ transport and storage and the capital grant, but lower financing costs and electricity prices remain necessary. The implication is that a viable policy package should combine shared infrastructure, first-mover capital support, and financial de-risking rather than rely on one technology subsidy.
Early projects may proceed differently from the national-scale system assumed in the base case. The announced Indian direct-separation projects plan to sell or use captured CO₂ rather than pay for permanent storage. Utilization is not a substitute for national storage strategy, however since CO₂ merchant markets are limited, and the climate value depends on the durability of the CO₂ use.
The waterfall pattern is more important than any single step. No instrument closes the gap alone. The largest reductions come from cheaper CO₂ transport and storage and the capital grant, but lower financing costs and electricity prices remain necessary. The implication is that a viable policy package should combine shared infrastructure, first-mover capital support, and financial de-risking rather than rely on one technology subsidy or one early carbon price.
Our value-chain analysis shows where a low-carbon premium is most readily collected. The leading-group premium is about 35 percent of the assumed cement value at the plant gate, but only about 14 percent of the value of a cubic meter of ready-mix concrete and about 0.3 percent of the value of a finished 50-square-meter apartment unit. The average premium of the three electric routes, including the partially electrified hot-gas + MEA route, is about $39 per tonne of cement and still accounts for less than 1 percent of the apartment value (Figure ES-4).
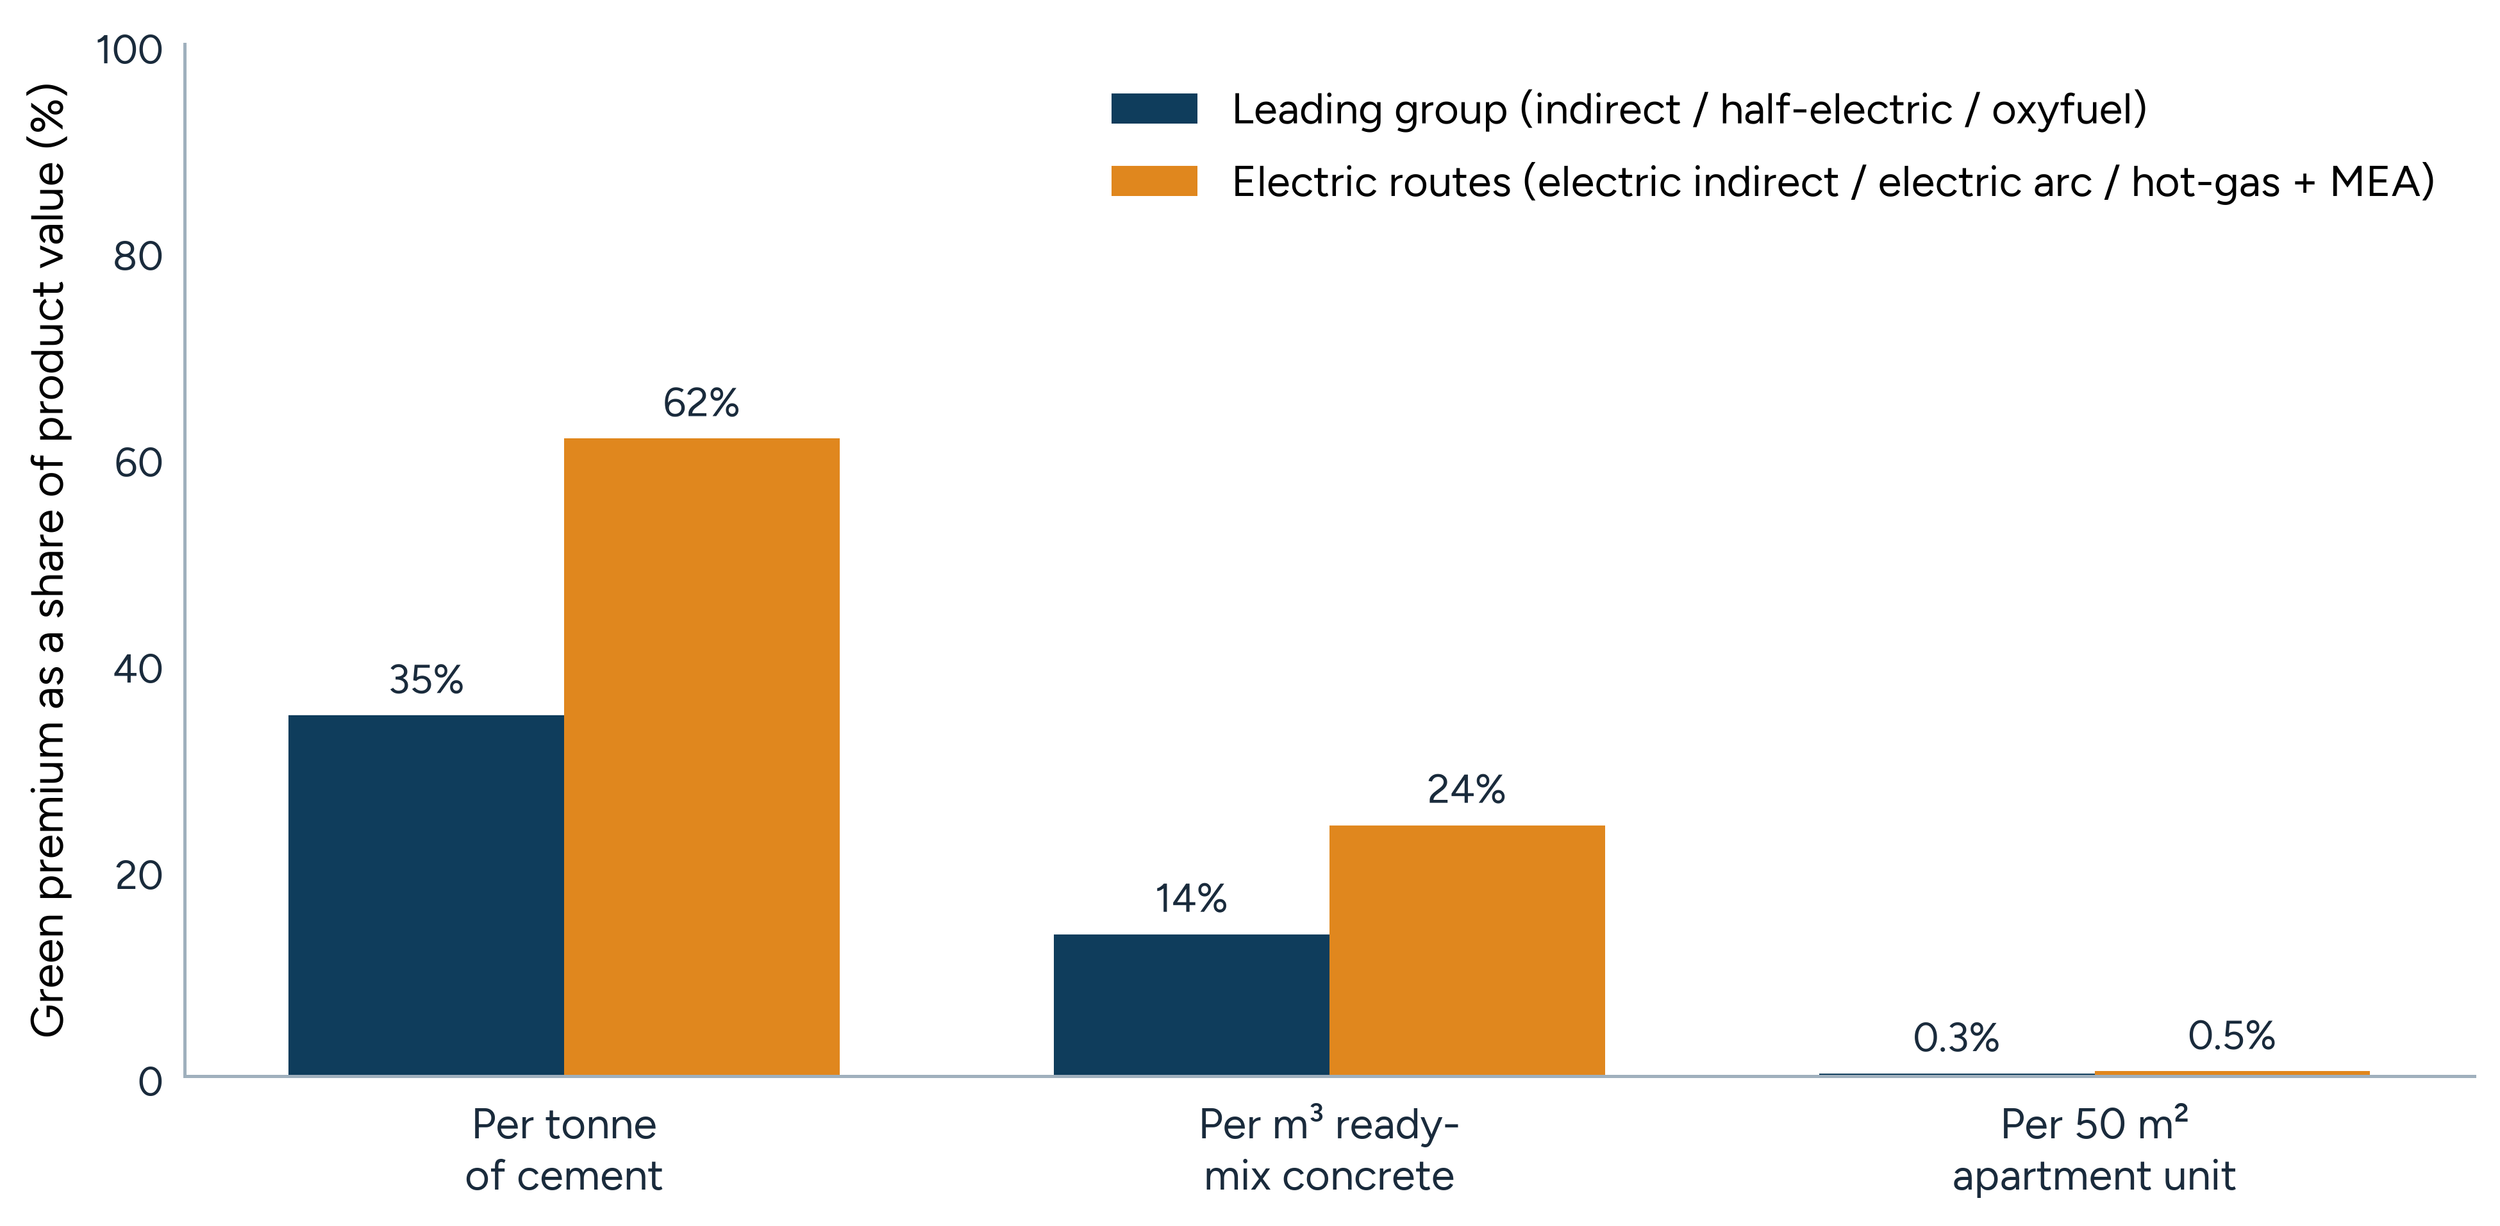
Figure ES-4. The low-carbon cement cost premium as a share of product value at three value-chain stages in India, for the leading technology routes and the electric routes (electric indirect, electric arc/plasma, and hot-gas + MEA).
This dilution of green premium down the value chain is the economic basis for green public and private procurement. A buyer specifying low-carbon cement in a building, road, or public works project can create a strong demand signal for the cement producer while adding little to the total project budget. The value-chain perspective shows that it is easier to absorb the green premium at the point of final use where cement cost represents a small share of total value. The dilution assumes that costs pass through the chain; where an intermediate step holds market power, part of the premium can be retained or amplified rather than passed on. This asymmetry supports procurement rules, low-carbon material standards, and long-term offtake contracts that convert downstream willingness to pay into bankable plant-level revenue.
When looking at the uncertainty ranges, the three leading routes overlap substantially, so their position in the leading technology routes matters more than their exact order (Figure ES-5). The fully electric routes remain higher even at the favorable end of their uncertainty ranges, and their ranges are widest because renewable share, firming cost, and electric-duty assumptions interact. The upper end of the leading technology routes is driven mainly by higher CO₂ transport and storage, a national infrastructure variable rather than a technology performance variable.
The overlap should not be interpreted as evidence that all routes are equivalent. The base-case estimates remain distinct, and the stress tests preserve the leading technology group in almost every case. The figure instead shows where present evidence is too limited to support a precise ranking and where public action can compress uncertainty. Storage planning, lower financing costs, and commercial demonstrations can narrow the leading technology routes’ ranges, and the electricity-sector development pathway will determine how far the electric routes move in each direction.
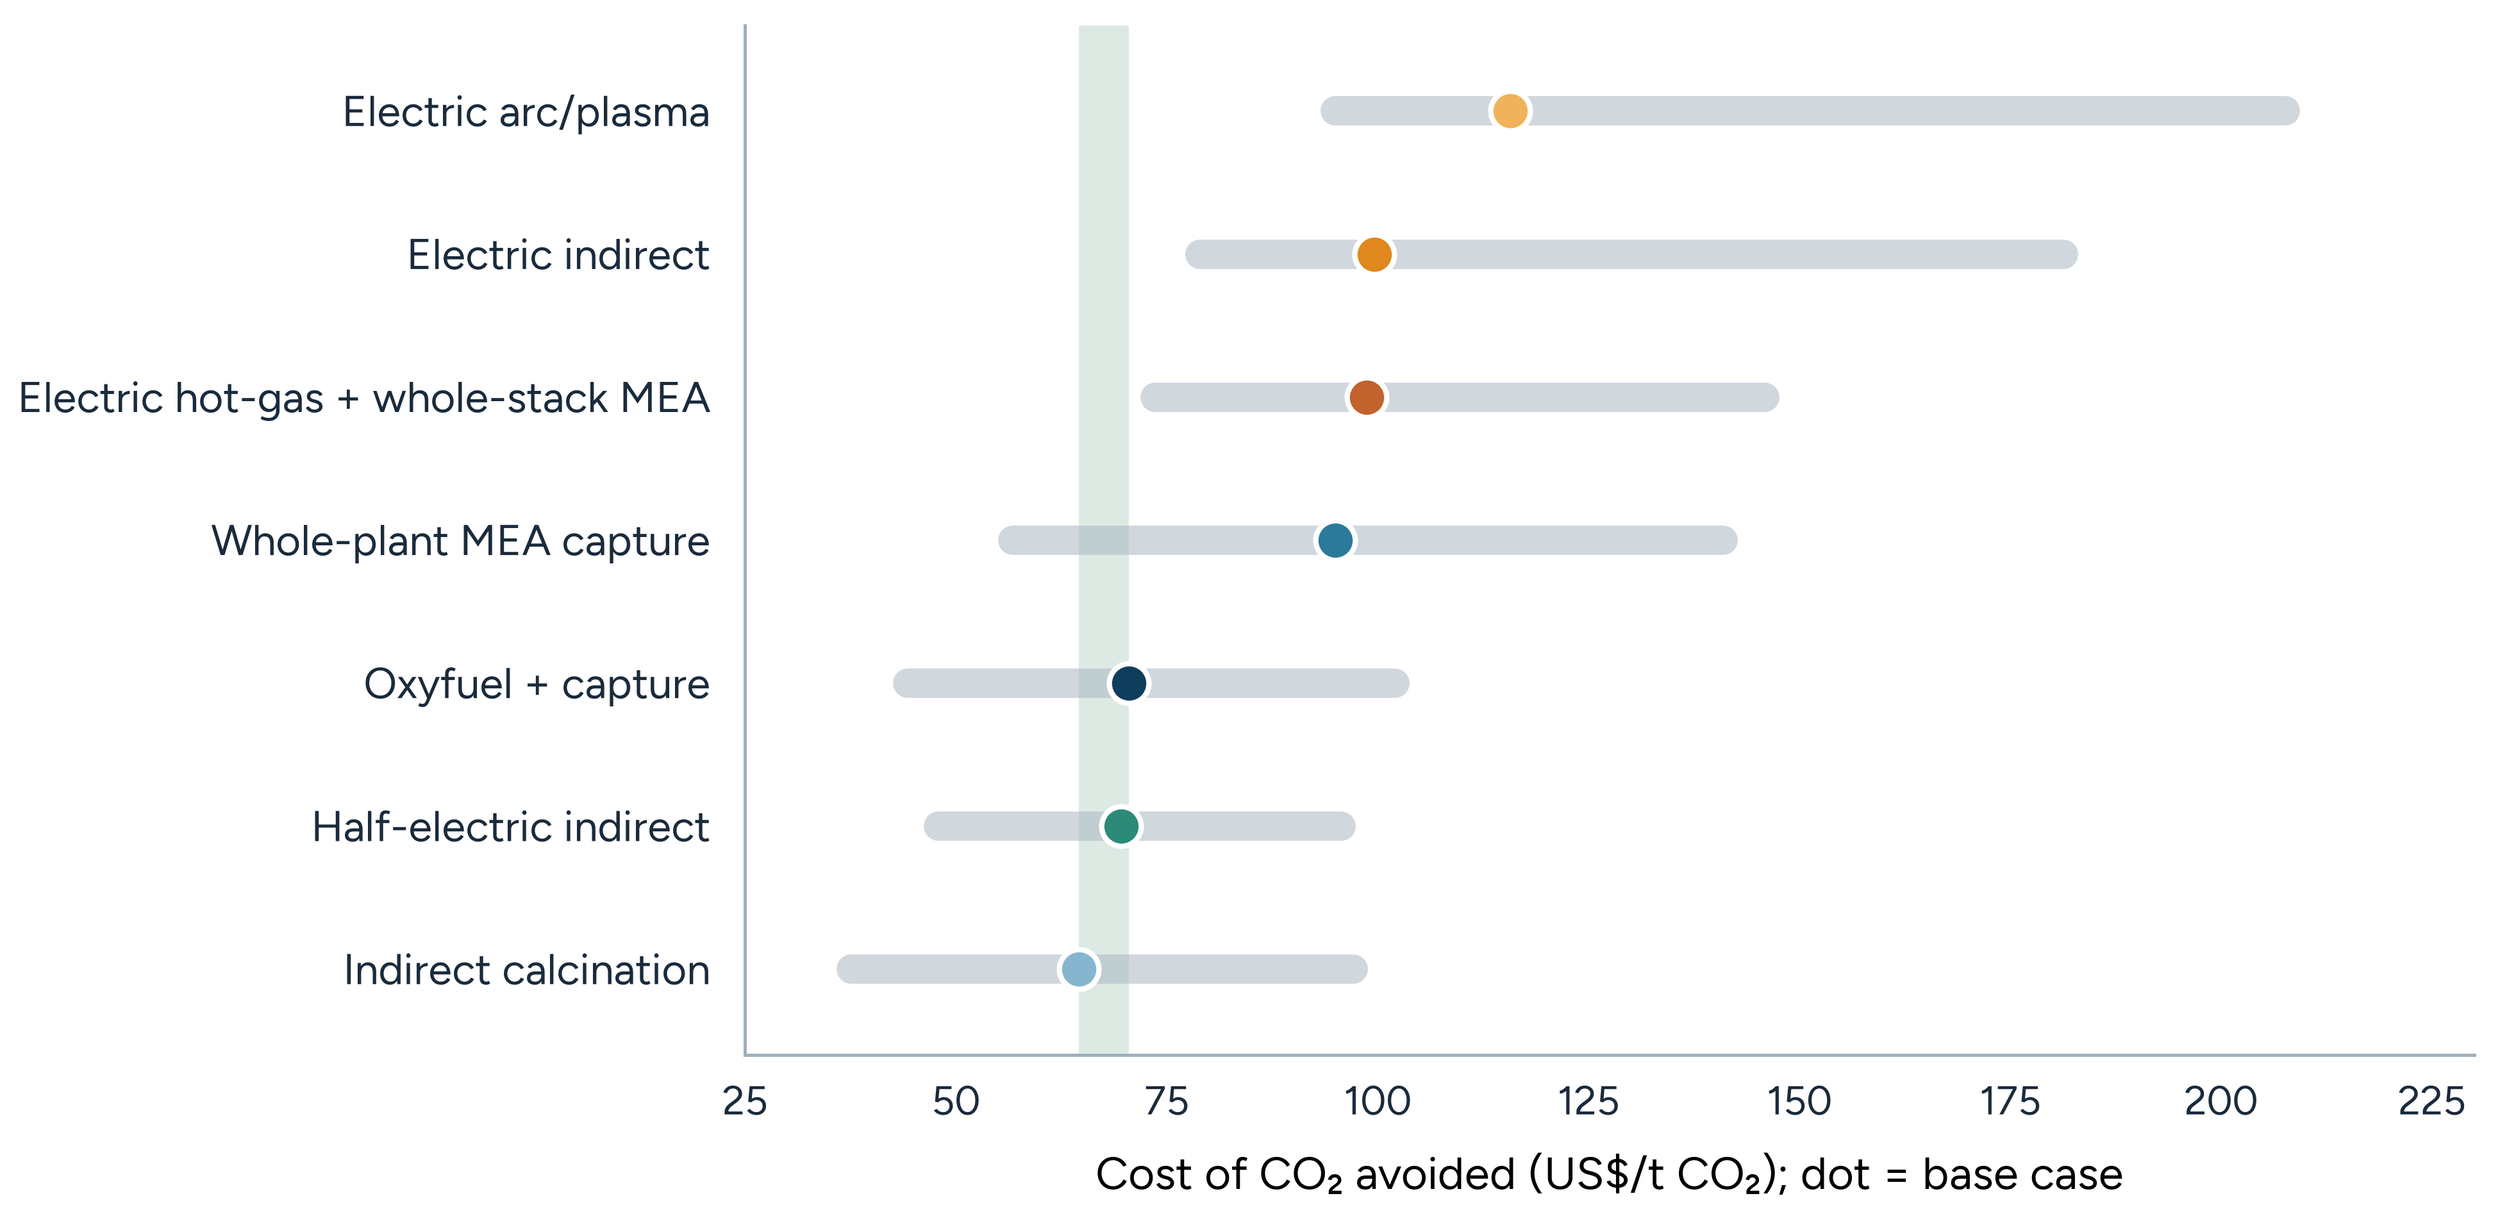
Figure ES-5. Range in the cost of CO₂ avoided by route under the most influential uncertainties, with the base case marked; the shaded vertical band is the leading technology routes’ base case range.
If any of deep-decarbonization routes were deployed across an illustrative 20 percent of India’s projected 2070 clinker output, it would avoid roughly 100 to 158 Mt of CO₂ each year, applying the reference plant’s lifetime-average abatement to that output. Combined incremental plant-side investment would be on the order of $7 to $15 billion for the direct-separation routes and up to about $22 billion for the most capital-intensive route, with lower values possible as first-of-a-kind costs fall. Shared CO₂ transport-and-storage infrastructure would be additional.
The most important immediate action is to make new cement plants in India capture- and electrification-ready. India can reserve space, process interfaces, electrical capacity, and CO₂ handling provisions while plants are being designed, preserving the option to install capture, separation, or larger electric systems later. Our study does not estimate a precise readiness premium, but the strategic asymmetry is clear and design-stage provisions are generally far less disruptive than retrofitting an operating plant built without them.
India’s Carbon Credit Trading Scheme (CCTS) provides an institutional starting point but is unlikely to finance deep precalciner abatement on its own in its early years. Early market expectations of roughly $7 to $11 per tonne of CO₂ are far below the lifetime breakeven carbon prices for the leading precalciner decarbonization technology group. Those projects require about $79 to $95 per tonne without support, falling to about $52 to $62 with the full policy support package shown above. The expected early CCTS price and the breakeven prices are different metrics, but the gap demonstrates that carbon pricing must be combined with supply-side support, green procurement, and infrastructure.
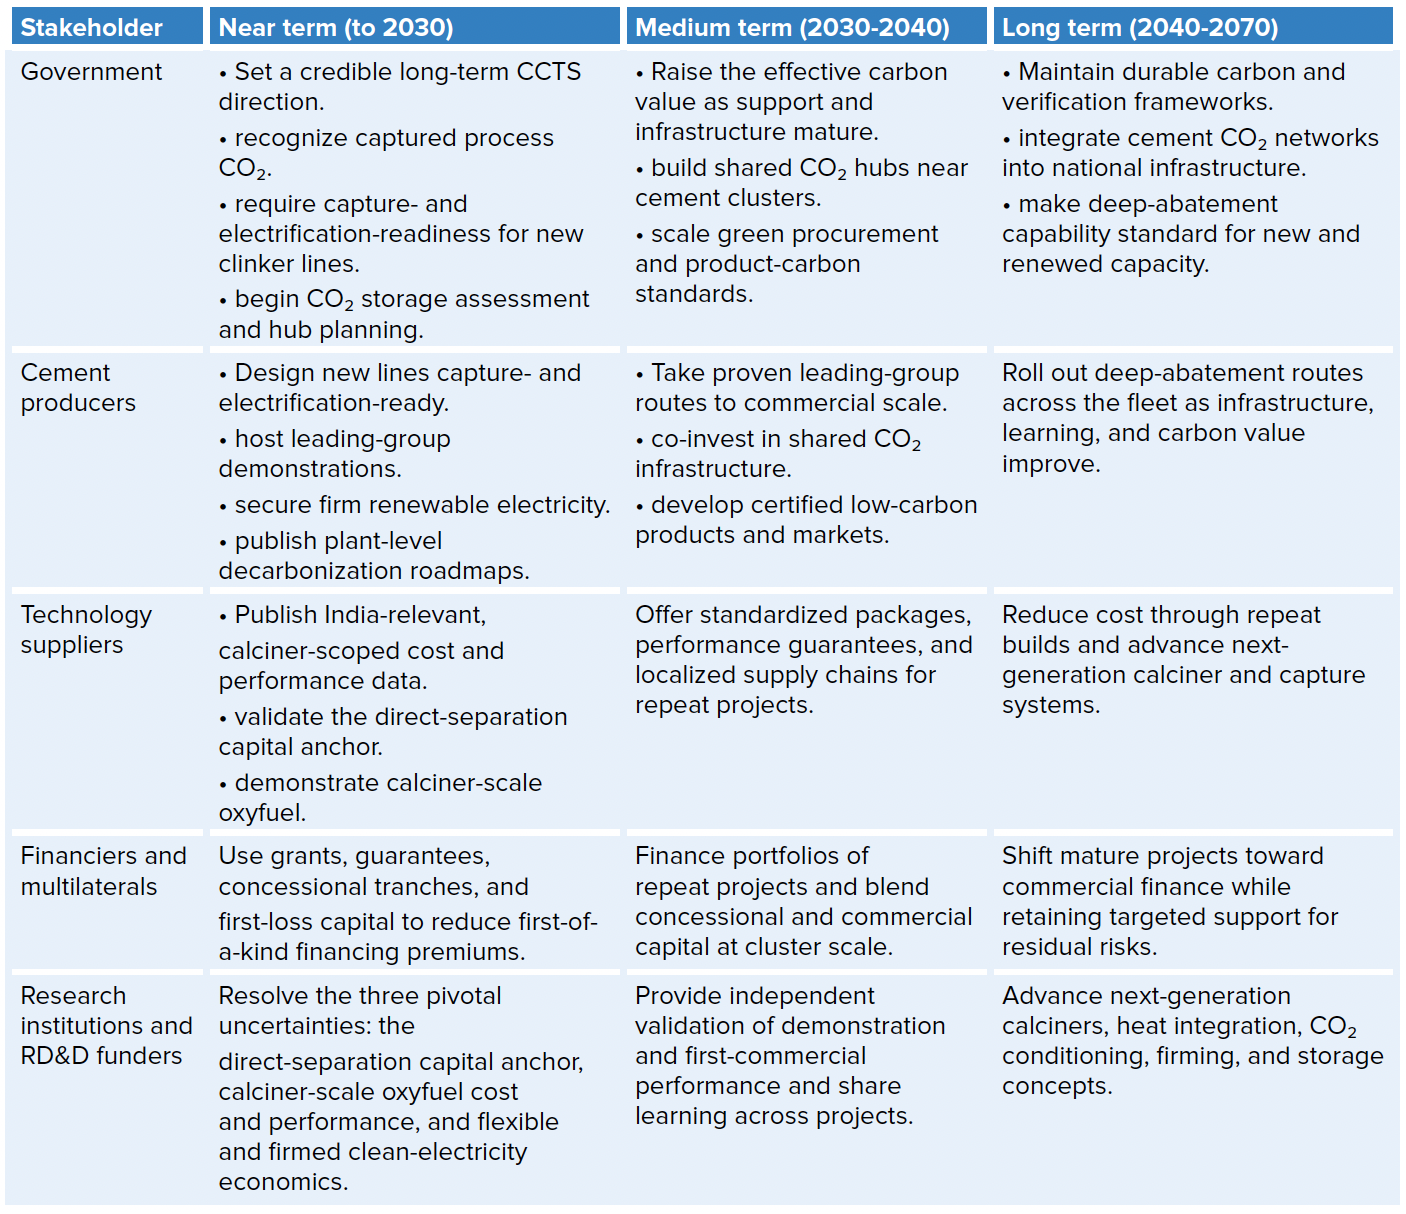
Our recommended deployment sequence follows directly from the results of our analysis. Through 2030, India should require capture- and electrification-readiness for new cement production lines, complete the commercial direct-separation project planned (Leilac and Ambuja Cements), demonstrate calciner-scale oxyfuel, advance an India-relevant commercial capture project, begin shared CO₂ hub planning, and lower the cost of capital for first movers. During the 2030s, India should deploy the first commercial portfolio where carbon revenue, financing, and CO₂ outlets align, while developing deep electric routes at sites with favorable RE electricity access. From 2040 onward, deep-abatement capability should become standard for new, replacement, and substantially renewed cement capacity (Table ES-1).
One key takeaway from our study is that India does not need to wait for one perfect technology. The leading capture and separation routes are close enough in cost to support a portfolio approach, and the fully electric routes can mature alongside them as the electricity system changes. The near-term priority is to preserve options in new cement plants, implement more pilot and demonstration of these technologies, and begin the shared infrastructure that CO₂ capture projects cannot build alone. Acting during the current capacity expansion keeps the transition manageable. Delay turns design choices into more difficult retrofits and locks in conventional emissions for decades.
Although this study is developed for India, its findings carry well beyond it. Most of the world's new cement capacity is being built in developing countries that share India's starting conditions of coal-fired kilns, young plant fleets, limited CO₂ infrastructure, and rapidly growing demand. The technology comparison, the readiness logic, and the policy package developed here are therefore directly relevant to those markets, and early Indian deployment would create cost and engineering evidence that the whole developing world can use.
Table ES-1. Action matrix by stakeholder and time horizon for deep-decarbonization of precalciner in cement plants in India
To read the full report and see complete results and analysis of this new study, download the full report from the link above.
Interested in data and decarbonization studies on the global cement industry? Check out our list of cement industry publications on this page.
Don't forget to follow us on LinkedIn and X to get the latest about our new blog posts, projects, and publications.