
The Steel Behind the Goods
How Indirect Trade Reshapes the Picture of US Steel Consumption and Emissions
WHITE PAPER
Author: Ali Hasanbeigi, PhD
The United States is often described as having one of the world's cleaner steel industries because about 71% of its crude steel is produced in electric arc furnaces (EAFs). That is an important advantage on a production basis. But it does not fully describe the steel that the United States actually consumes.
A large amount of steel enters the US indirectly, embodied in manufactured goods such as vehicles, machinery, appliances, and metal products. Our new white paper, The Steel Behind the Goods, uses World Steel Association (worldsteel) indirect trade data and GEI steel benchmarking as well as other sources to examine what happens when these flows are included in the accounting.
In 2023, US apparent steel use was about 91 million tonnes (Mt). Once net indirect imports are added, true steel use rises to about 124 Mt. The difference of about 34 Mt is the net balance of steel embodied in imported and exported manufactured goods. Under our base-case attribution, approximately 41% of the steel consumed in the United States was net imported: about 14% as steel products and another 27% embodied in manufactured goods.
This changes the picture of the US steel system substantially.
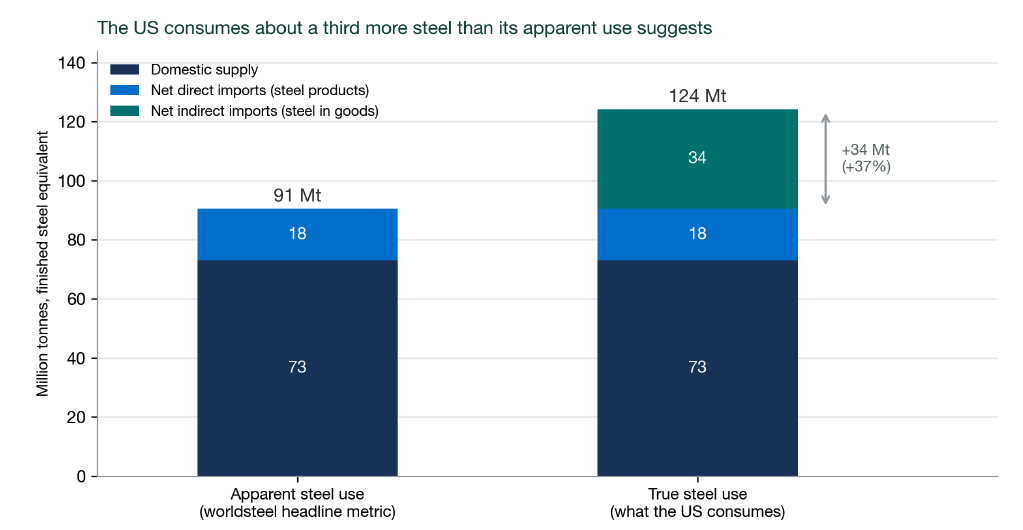
Figure 1. US apparent steel use versus true steel use, 2023, Mt finished steel equivalent
Notes: Net imports are imports minus exports. Source: GEI analysis based on World Steel Association (worldsteel) data.
The US EAF advantage narrows on a consumption basis
On a production basis, about 71% of US steel is produced through the EAF route. When imported steel is assigned the production-route mix of major exporting countries, the estimated EAF-route share of US steel consumption falls to about 55%. The US therefore remains above the European Union, Japan, and China on a consumption basis, but it is much less exceptional than production statistics suggest. Its advantage over the EU falls from roughly 26 percentage points on a production basis to about 9 percentage points on a consumption basis. Mexico and Türkiye have higher consumption-basis EAF-route shares, although EAF production in countries such as Mexico and India includes substantial direct reduced iron and should not be interpreted as fully scrap-based secondary steel.
Our analysis shows that production statistics describe the steel made within national borders, while consumption-based statistics better reflect the mix of steel that ultimately supports domestic demand. For large importing economies, the difference can be substantial.
The emissions advantage also largely disappears
The same shift appears in carbon intensity. On a production basis, US steel has an estimated emissions intensity of about 1.0 ton CO2e per ton of crude steel. On a consumption basis, this rises by roughly 40% to about 1.4 ton CO2e per ton. That moves the United States from about 27% below the EU on a production basis to roughly parity with the EU on a consumption basis. Sensitivity analysis shows that the US result varies depending on how exports are attributed and how the imported steel mix is estimated, but none of the tested cases restores the production-basis emissions advantage over the EU.
Import dependence matters for steel and climate policy
Our analysis also shows that US steel self-sufficiency was about 59% in 2023 when both direct and indirect trade are considered. This ratio has remained near that level for much of the past decade. This has important policy implications. Measures focused only on domestic steel production address only part of the steel associated with US consumption. Direct steel imports can be addressed through instruments such as border measures and steel-product standards. But a much larger challenge is the steel embodied in vehicles, machinery, metal products, appliances, and other manufactured goods.
Consumption-based indicators therefore provide an important complement to conventional production statistics. They do not diminish the advantages of the US domestic EAF fleet. Instead, they show that assessing steel decarbonization only at the point of production can miss a substantial share of the steel and emissions associated with domestic consumption.
The white paper examines these issues in more detail, including sensitivity analysis, comparisons with other major steel-producing economies, and trends in steel self-sufficiency across major regions.
To read the full white paper and see complete results and analyses, download the it from the link above.
Interested in data and decarbonization studies on the global steel industry? Check out our list of steel industry publications on this page.
Don't forget to follow us on LinkedIn and X to get the latest about our new blog posts, projects, and publications.