Coal in Cement and Concrete
Global, country-, and company-level analysis of coal consumption in the cement industry
Authors: Ali Hasanbeigi and Hanjie Wang
The cement industry is among the world’s most energy-intensive and carbon-intensive industrial sectors. It accounts for more than 7 percent of global CO₂ emissions, resulting from both the chemical release of CO₂ during limestone calcination and the combustion of fuels required to reach the high temperatures needed for clinker production. In 2024, total fuel consumption in the global cement sector exceeded 10,100 petajoules (PJ).
Global cement production reached about 4,000 million tons in 2024, after nearly tripling between 2000 and 2021. Over the past decade, production has remained relatively stable. China continues to dominate the sector, producing around half of global cement, driven by rapid urbanization and major infrastructure development. Most of this output is consumed domestically. Looking ahead, global cement demand is expected to stay roughly at current levels, with a possible rise of 10-20 percent by 2050. Demand patterns will differ across regions: China’s demand is projected to fall as its construction boom slows, OECD countries are expected to see a steady long-term decline, and growth will be driven mainly by expanding populations and urban development in Africa, Asia, and the Middle East.
Cement manufacturing centers on producing clinker, the intermediate material formed when limestone and other raw materials are heated to about 1,450°C in large rotary kilns. Because these temperatures must be maintained continuously and precisely, clinker production is the most fuel-intensive step in the process and accounts for more than 95 percent of the energy use and CO₂ emissions in cement production. After clinker is produced, it is mixed with gypsum and supplementary cementitious materials such as blast furnace slag, fly ash, or limestone during finish grinding. While clinker production relies mainly on thermal energy, electricity is used throughout the process, for raw material preparation, grinding, kiln operation, and final cement milling.
Coal plays a central role in supplying the heat needed for clinker formation, and in many countries bituminous or sub-bituminous coal remains the dominant fuel. However, fuel mixes vary widely. Some plants rely on petcoke, lignite, or natural gas, while others have increased the use of alternative fuels such as biomass and waste-derived materials. European plants often substitute more than 50 percent of fossil fuels with alternatives, while substitution rates in China, India, Indonesia, and other emerging economies remain much lower. These differences reflect variations in fuel availability, prices, regulations, and investments in alternative fuels supply systems. This report provides a detailed assessment of coal and total fuel use in the global cement industry, examining fuel consumption at both country and company levels, for major cement producers.
Because national energy balances do not report cement sector-specific energy use separately, our analysis fills an important data gap by providing a consistent, comparative picture of how coal is used across the world’s major cement producers and firms. We have done this by using clinker production levels, thermal energy intensity, clinker-to-cement ratios, and the share of coal in each country’s fuel mix. Our analysis covers 13 major cement-producing countries plus the EU-27 (representing 80 percent of global cement output in 2024) and an aggregated “other countries” group. All coal used in cement production is thermal coal, with “bituminous coal” making up about 85 percent of consumption. Some plants, especially in India and other developing countries, also operate captive coal power units, though these were not included in this study due to data limitations. Total coal use in 2024 reached about 284 Mt coal, equal to roughly 7,110 PJ, while other fossil fuels and alternative fuels contributed another 3,000 PJ. In total, the global cement sector used around 10,100 PJ of fuel in 2024, not including electricity (Figure ES1).
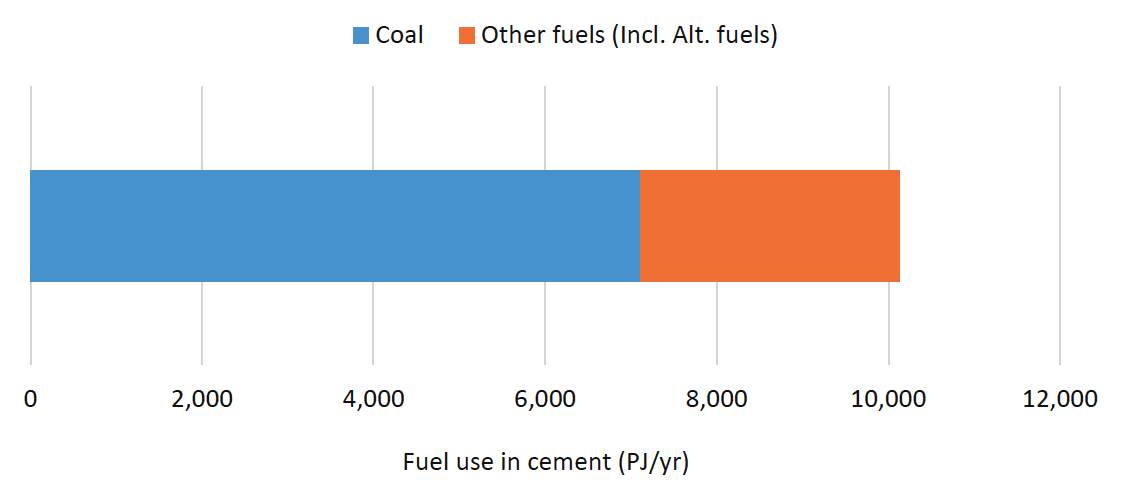
Figure ES1. Total coal and other fuels used in the global cement industry in 2024 (Source: GEI analysis)
For comparison, annual coal use in the global cement industry in 2024 was more than six times higher than total coal consumed in the U.S. manufacturing sector in 2022 (including coal used in coke plants and industrial combined heat and power in the U.S.), and was roughly 68 percent of all coal used in either the United States or the EU-27 (EIA 2023, IEA 2025b). Total annual fuel use in the global cement industry including coal and other fuels (10,110 PJ) was about 20 percent higher than all fuels used in the U.S. manufacturing sector, and six times higher than the fuels used in the entire German manufacturing sector in 2022 (GEI analysis based on IEA 2025a).
China is the world’s largest consumer of coal in cement production by a wide margin, using an estimated 164 Mt of coal in 2024. This accounts for roughly 58 percent of all coal used in the global cement industry and reflects both the country’s large production volume and its high dependence on coal as the primary fuel in its cement industry. Beyond China, India consumed about 18 Mt of coal, while Vietnam, Türkiye, Indonesia, and the United States each used between 4 and 12 Mt of coal. A large group of “other countries” together consumed 54 Mt of coal, showing that although many medium-sized producers rely on coal, their individual contributions are much smaller. Overall, the top five coal-consuming countries China, India, Vietnam, Türkiye, and Indonesia account for almost three-quarters of global coal use in the cement industry.
Fuel mixes vary widely across countries, and coal does not dominate everywhere. In India, the United States, the EU-27, Russia, Mexico, and Brazil, other fuels make up a larger share of total fuel consumption (Figure ES2). Petcoke is a major contributor in many of these markets, while natural gas is the leading fuel in Russia and accounts for about one-third of total fuel use in the cement industry in the United States. Brazil relies heavily on biomass, and the EU-27 uses significant quantities of biomass and waste-derived fuels due to strong policy support for alternative fuel substitution. These differences highlight that while coal remains essential in many regions, especially Asia, fuel diversification is already substantial in several major cement-producing economies.
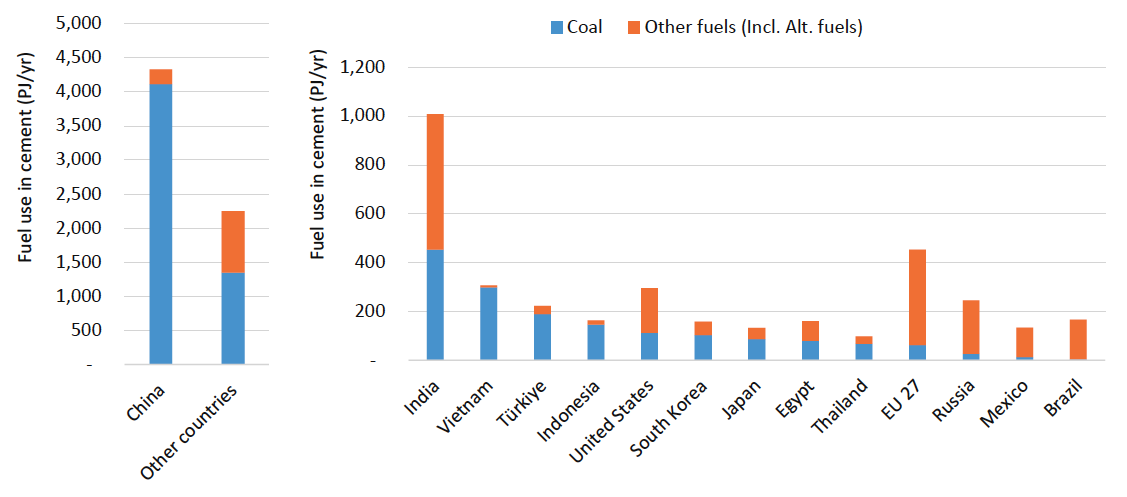
Figure ES2. Coal and other fuels used in the cement industry in each country in 2024 (Source: GEI analysis)
The six major cement companies examined Anhui Conch Cement (China), CNBM (China), UltraTech Cement (India), Holcim (Switzerland), Heidelberg Materials (Germany), and CEMEX (Mexico) together manufactured about 907 Mt of cement in 2024. This represents roughly 23 percent of global cement production, highlighting the scale and influence of these few firms within the global cement industry. Their operations span diverse regional markets, with Holcim, Heidelberg Materials, and CEMEX each operating in more than 50 countries. Because of their size and geographic reach, these companies play a central role in shaping industry-wide fuel use patterns and decarbonization strategies.
These six firms combined consumed an estimated 50 Mt of coal in 2024, equal to around 18 percent of global coal use in cement production. Anhui Conch Cement was the largest coal user at more than 20 Mt, followed by CNBM at over 17 Mt. Among non-Chinese companies, UltraTech Cement used about 5.3 Mt, Heidelberg Materials 4.5 Mt, Holcim 1.9 Mt, and CEMEX 0.7 Mt. When considering total fuel use including coal, petcoke, natural gas, biomass, and waste-derived fuels, the six companies consumed about 2,152 PJ in 2024.
Fuel mixes differ considerably: Anhui Conch Cement and CNBM remain heavily coal-dependent, with coal supplying close to 90 percent of their fuel energy, while UltraTech uses around 50% petcoke in its fuel mix. Holcim and CEMEX rely far less on coal using extensive amounts of alternative fuels and petcoke with coal representing only about 12-13 percent of their total fuel use. Heidelberg Materials falls in the middle, with coal supplying around one-third of its total fuel demand.
Fuel use in cement plants varies widely because facilities rely on different fuel mixes, even within the same country. For that reason, it is not possible to define a single “typical” coal consumption value. Instead, fuel use is best described through energy intensity metrics. Almost all fuel consumption and CO₂ emissions come from producing clinker the intermediate product formed when limestone and other raw materials are heated to about 1,450°C. Modern dry-process kilns with preheaters and precalciners typically require about 3.5 GJ per ton of clinker, with most plants falling in the 3.3 to 3.7 GJ per ton of clinker. Less efficient or older kilns may consume over 4 GJ per ton, while best-performing systems can reach 2.9 to 3.0 GJ per ton. Because fuel use is tied to clinker production, overall cement fuel intensity depends on the clinker content of the final product. With a clinker-to-cement ratio of 0.80 which is common for blended cements the corresponding average thermal energy intensity is about 2.8 GJ per ton of cement. Some alternative fuels such as biomass or MSW can raise the thermal energy intensity of clinker production because their higher moisture content and lower calorific value require more heat to achieve stable kiln operation.
If all thermal energy in a cement plant were provided by coal, then 3.5 GJ per ton of clinker would translate to 0.14 tons of coal per ton of clinker, and 2.8 GJ per ton of cement would translate to 0.112 tons of coal per ton of cement. For a cement plant producing one million tons of cement per year, this would result in 112 kilotons of coal use annually.
Electricity use in cement manufacturing is spread across raw material grinding, the kiln system, and finish grinding, with the last stage often accounting for about 40 percent of total electricity use. A typical cement plant uses roughly 100 kWh of electricity per ton of cement, with most plants operating between 90 and 110 kWh per ton of cement depending on raw material hardness, grinding technology, and product fineness. Best-practice plants can reach around 85 kWh per ton.
In this study, we provide the detailed fuel-use and coal-use insights needed to guide realistic decarbonization strategies, inform national policy design, and support cement companies as they plan long-term investments in decarbonization. For policymakers, the results highlight where coal dependence remains entrenched and where alternative fuels are already scaling, helping identify priority regions for regulatory support, fuel-transition incentives, low-carbon waste-to-energy policy development, and carbon-pricing or standards that reflect real sector conditions.
The most effective way for the cement industry to cut its dependence on coal and other fossil fuels is to lower the clinker content of cement and concrete through much greater use of supplementary cementitious materials, including both conventional SCMs (blast furnace slag, fly ash, limestone) and calcined clay. Recent commercial advances in calcined clay production and its successful deployment in the cement and concrete industry globally show that clinker content can be reduced substantially without sacrificing performance and, in many cases, while lowering cost. Calcined clay cement production technologies are mature, available now, and can significantly cut both the energy demand and the carbon footprint of cement and concrete. Given their strong potential for rapid, near-term impact, cement and concrete producers should scale up calcined clay cement production quickly, and governments should support this shift through tools such as green public procurement, standards updates, and other enabling policies.
To read the full report and see complete results and analysis of this new study, download the full report from the link above.
Interested in data and decarbonization studies on the global cement industry? Check out our list of cement industry publications on this page.
Don't forget to follow us on LinkedIn and X to get the latest about our new blog posts, projects, and publications.