The Effect of a U.S. Border Carbon Adjustment on the Aluminum Industry and Trade
An Assessment of the Foreign Pollution Fee Act and the Clean Competition Act
Authors: Ali Hasanbeigi, Pinchookorn Chobthiangtham, Ben Ladabaum
Members of both parties in the U.S. Congress have put forward several proposals for Border Carbon Adjustment (BCA) policies, also referred to as border carbon fees to address carbon leakage and protect the competitiveness of domestic energy-intensive industries. Aluminum is central to this debate. It is strategically important for defense, transportation, infrastructure, and clean energy systems, yet the United States remains heavily dependent on imports despite maintaining domestic production capacity. Carbon intensity in aluminum production varies widely across countries, driven primarily by electricity mix and the balance between primary and secondary production. These characteristics make aluminum one of the most consequential sectors for evaluating border carbon adjustment design.

In this report, we evaluate two leading legislative proposals: the Foreign Pollution Fee Act (FPFA) and the Clean Competition Act (CCA). Both seek to address carbon leakage and level the playing field for lower-carbon U.S. producers. However, they differ fundamentally in structure, economic mechanism, and expected market and greenhouse gas (GHG) emissions impact. Chapters 4 through 8 provide a detailed comparison of the aluminum market context, projected trade, revenue, GHG emissions impacts, and policy design considerations. The findings highlight clear trade-offs between speed, disruption risk, revenue volatility, and long-term structural coherence.
U.S. aluminum industry context
As of 2025, the United States operated six primary aluminum smelters across five states, with only two operating at full capacity. Total primary output was approximately 0.66 million tons (Mt), well below installed capacity of 1.31 Mt. Secondary aluminum production was significantly higher, at roughly 3.6 Mt, showing the strong role of recycled material in domestic supply. This high secondary aluminum share (about 84 percent of total U.S. aluminum output) is a defining feature of the U.S. aluminum sector and the single biggest reason the U.S. weighted-average carbon intensity is low relative to most major aluminum-producing countries. A proposed 750 kton/year smelter in Oklahoma, backed by Emirates Global Aluminum and Century Aluminum, could significantly expand U.S. output if realized,
Despite domestic production, the United States remains import dependent. In 2024, the United States imported approximately 5.7 Mt of aluminum products and 1.0 Mt of articles of aluminum (See Table 1-2 in Chapter 3.2 for a detailed breakdown of aluminum product categories). Canada accounted for 49 percent of imports and Mexico for 4 percent, together representing 53 percent of total U.S. aluminum imports. Other major suppliers include China, India, Vietnam, South Korea, and Brazil. US consumption of crude and semi-fabricated aluminum products alone was around 5.83 Mt in 2024.
Electricity is the dominant driver of carbon intensity in primary aluminum production. Facilities supplied by coal-based electricity have significantly higher emissions than those supplied by hydro or other renewable sources. This wide international variation in carbon intensity creates the economic basis for a border carbon adjustment mechanism. In the United States, the electricity mix varies across the remaining operating smelters. One facility in Indiana relies mainly on captive coal-based power, one in New York is supplied primarily by hydropower, and two others in South Carolina and Kentucky depend on grid electricity with mixed generation sources.
Policy design: Foreign Pollution Fee Act (FPFA) versus Clean Competition Act (CCA)
Both the FPFA and the CCA seek to address carbon leakage and strengthen the competitiveness of lower-carbon U.S. producers, but they differ fundamentally in design and impact. The structural difference between the two approaches shapes their economic effects.
The FPFA functions primarily as a border-based carbon tariff. It applies a variable charge to imports based on carbon intensity and country classification. It does not impose a domestic carbon fee. Its effect is concentrated at the border and resembles an ad valorem tariff adjustment. This structure generates strong immediate trade shifts.
Table ES1. Side-by-side comparison of FPFA and CCA

The CCA combines a domestic carbon fee with a border adjustment. U.S. producers pay a carbon fee only on emissions above an industry baseline, and imports are charged based on the gap between foreign carbon intensity and the U.S. benchmark. The CCA also includes export rebates and a declining applicable percentage schedule. This creates a more integrated carbon pricing framework rather than a tariff-style instrument.
Trade impact modeling
Using a data-driven framework and elasticity-based modeling, we assess the trade and revenue impacts of both proposals from 2026 through 2030. Under the FPFA, trade effects are sharp and immediate (Figure ES1). Under an elasticity assumption of -1.0, imports from high-emission suppliers such as China and India fall to near zero in the first year of implementation (2026). Imports from Vietnam decline by roughly 49 percent. This is because of high variable charges imposed on these countries under the current method proposed in FPFA. Canada and Brazil experience more moderate reductions due to lower carbon intensity (Figure ES2). Overall import contraction under higher elasticity scenarios exceeds current U.S. spare primary capacity. This creates a potential short-term supply gap and increases the risk of price volatility and supplier concentration.
Under the CCA, trade impacts are more gradual. Under the proposed carbon price in CCA and elasticity -1.0, import reductions in 2026 are modest relative to the FPFA, generally around 200,000 tons (Figure ES1). Country-level impacts remain uneven but not disruptive. Canada and several other lower-carbon suppliers experience minimal change (Figure ES2). The CCA shifts sourcing gradually away from higher-emission producers while maintaining diversified supply chains.
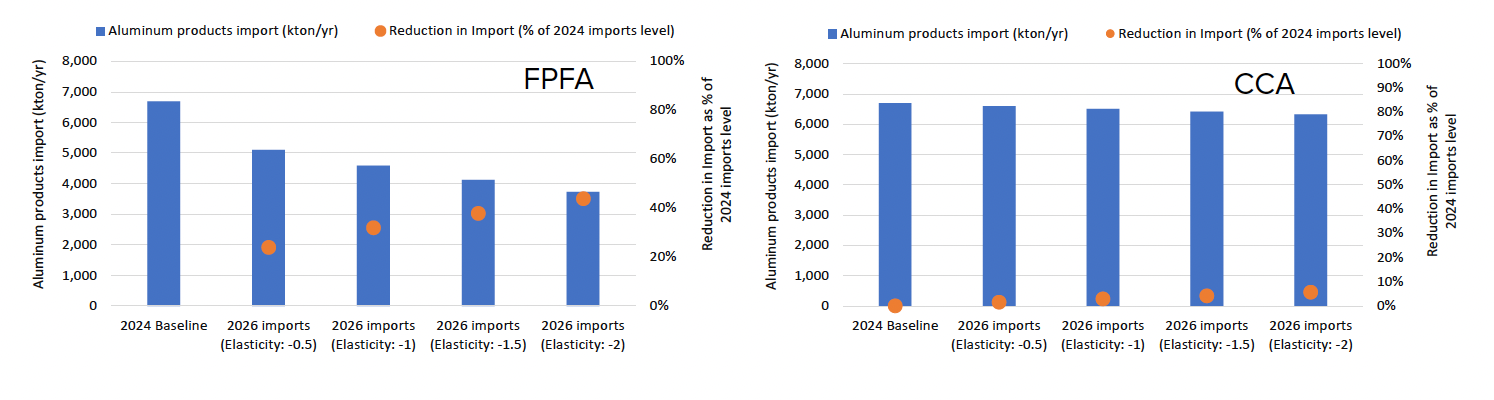
Figure ES1: Projected U.S. aluminum imports in 2026 compared to 2024 import level from current aluminum suppliers due to the FPFA (left graph) and CCA (right graph) under different elasticity scenarios (Source: this study)

Figure ES2. Annual reduction in U.S. aluminum imports from each country in 2026 as % of 2024 import level due to the FPFA (left) and CCA (right) under elasticity -1.0 (Source: this study)
Sensitivity analysis shows that excluding Canada and Mexico from CCA coverage significantly moderates trade impacts under both policies. Because these two countries account for more than half of total U.S. aluminum products imports, exemptions materially reduce import contraction and revenue generation. This highlights the importance of coverage decisions in shaping both supply risk and fiscal outcomes.
Revenue outcomes
Revenue effects differ substantially between the two proposals. The FPFA generates substantial early-year revenue, particularly under lower elasticity assumptions. Annual revenue in 2026 ranges from approximately $3.4 to $5.1 billion, rising to about $3.9–7.1 billion by 2030, depending on trade responsiveness (elasticity) (Figure ES3). However, revenue declines sharply as imports contract under higher elasticity scenarios. The stronger the trade disruption, the lower the long-term revenue. This makes FPFA revenue highly volatile and sensitive to behavioral response.
The CCA produces more moderate but more stable revenue. Because it combines a domestic carbon fee with a border adjustment, revenue does not rely solely on import volumes. Under modeled scenarios, cumulative revenue through 2030 ranges from approximately $3.7 to $4.5 billion (Figure ES3). Revenue grows more gradually and is driven primarily by the carbon price trajectory rather than abrupt import collapse.
In both cases, revenue is not structurally stable. Under a tariff-style system, revenue falls as imports decline. Under a domestic carbon pricing system, revenue falls as facilities decarbonize and align with the baseline. Policymakers should therefore avoid treating projected collections as a long-term funding source.
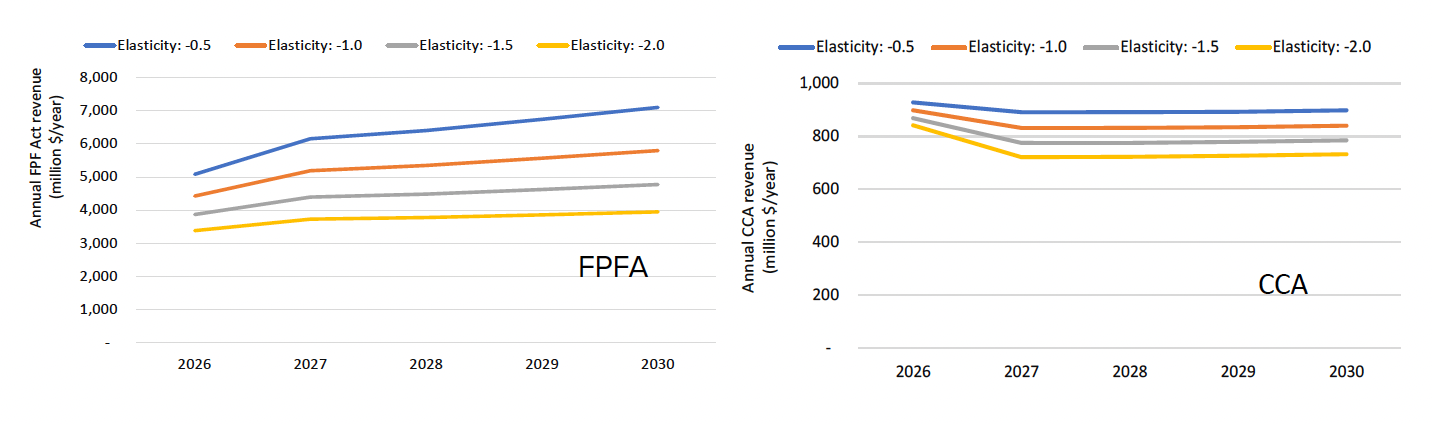
Figure ES3: Annual revenue from the FPFA (left graph) and CCA (right graph) from imported aluminum across elasticity scenarios, 2026-2030 (Source: this study)
Interaction with existing trade measures
U.S. aluminum imports are subject to a high-intensity and legally volatile tariff landscape. While the Supreme Court invalidated broad emergency and reciprocal tariffs under IEEPA in February 2026, the administration immediately replaced them with a temporary 15 percent global surcharge under Section 122 authority. Concurrently, Section 232 national security tariffs were restructured in April 2026 to apply a 50 percent duty to the full customs value of aluminum articles, significantly impacting major suppliers like Canada and Mexico that no longer benefit from broad exemptions. Additionally, Section 301 tariffs on China remain in effect, while new Section 301 investigations launched in April 2026 signal a shift toward more targeted duties on manufacturing overcapacity.
The FPFA, by design, stacks on top of existing tariffs unless otherwise clarified. This could significantly increase effective import costs. The CCA’s integration of domestic and border carbon pricing provides more internal symmetry but still requires clear interaction rules to avoid double counting. Careful statutory clarification is required to manage tariff stacking, equivalency recognition, and compatibility with international trade obligations. Without coordination rules, layering carbon-based charges on top of existing tariffs may amplify trade distortion beyond what is required to address carbon intensity differences. In addition, overly restrictive import conditions could constrain aluminum supply in the near term, given limited domestic primary capacity, potentially creating supply shortfalls. This may also raise broader concerns around industrial resilience and national security for critical material supply chains.”
Revenue distribution framework
A U.S. aluminum border carbon adjustment will generate federal revenue, but its purpose should not only be fiscal. Its core objective is to reduce carbon leakage, strengthen the competitiveness of lower-carbon production, and accelerate industrial decarbonization. Revenue should therefore be reinvested strategically rather than treated as general income.
In this report, we propose a framework centered on four pillars:
1. directing the largest share of revenue from the U.S. aluminum border carbon adjustment toward renewable electricity deployment for U.S. primary aluminum smelters;
2. allocating a smaller share of revenue from the U.S. aluminum border carbon adjustment to breakthrough technologies such as inert anode smelting and other process improvements;
3. supporting demand-side incentives such as green public and private procurement; and
4. dedicating a defined portion, consistent with the latest CCA structure, to targeted international partnerships that help decarbonize aluminum production in key allied supplier countries.
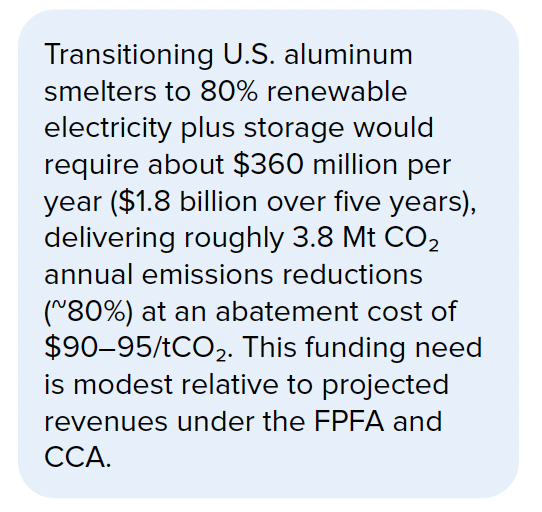
Our analysis shows that electricity decarbonization is the most impactful lever. Four operating U.S. smelters consume about 9.2 TWh of electricity annually and emit roughly 4.7 million metric tons (Mt) CO₂ per year. One smelter (in New York) is powered by hydropower, one smelter (in Indiana) mainly by onsite captive coal power generation and two smelters (in South Carolina and Kentucky) get power from the electric grid. Supplying 80 percent of their demand with renewable energy plus storage at an assumed cost of $110/MWh would require an estimated $360 million per year, or $1.8 billion over five years, to bridge the price gap with current electricity contracts. This shift would reduce emissions by about 3.8 Mt CO₂ annually, or roughly 80 percent, at an implied average abatement cost of around $90–95 per ton CO2. Compared with projected revenues under either the FPFA or the CCA, this subsidy requirement is relatively small, suggesting that reinvesting a portion of border carbon revenues into clean power for smelters could deliver large emissions reductions while preserving domestic production capacity.
Table ES2. Subsidy needed for 80% renewable electricity plus storage in the U.S. aluminum smelters vs revenues from FPFA and CCA
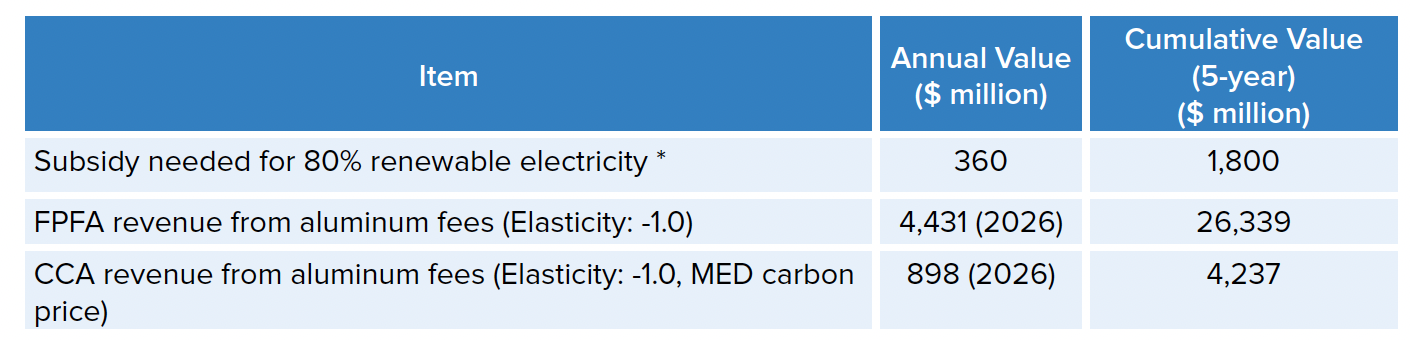
* This is a high-end estimate since over a 5-year period, the cost of firmed storage is likely to drop.
GHG emissions impact
Import reshaping under the FPFA could deliver significant emissions reductions of about 9.1 Mt CO₂ per year (under elasticity −1.0), compared to total 2024 aluminum and articles of aluminum import-related emissions of 25.3 Mt CO₂, while the CCA would result in more modest CO₂ emissions reductions of around 0.8 Mt CO₂ per year due to smaller shifts in import patterns.
The emissions reduction estimates presented here reflect only the direct effect of import reshaping and the reduced carbon intensity of imported aluminum relative to baseline trade patterns, rather than a comprehensive assessment of total long-term climate impacts. The larger emissions reductions estimated under the FPFA compared to CCA primarily result from stronger shifts in import patterns and import contraction, driven by the FPFA's higher charges on the highest-carbon-intensity producers (notably China and India), which represent the high-emissions end of U.S. aluminum imports. In the aluminum sector, where emissions are highly dependent on electricity source for primary aluminum production and U.S. production is generally less carbon intensive than some major exporters, import reshaping can produce meaningful emissions reductions.
However, the estimates do not include additional emissions reductions that could be achieved if carbon fee revenues are reinvested into aluminum sector decarbonization in the United States and globally. Under the current CCA framework, revenues are explicitly allocated with 75% directed to domestic decarbonization and 25% to international decarbonization support, while the FPFA currently does not specify a formal revenue allocation mechanism. As discussed in the proposed revenue distribution framework above, transitioning U.S. aluminum smelters to 80% renewable electricity plus storage would require approximately $360 million per year ($1.8 billion over five years) and could reduce annual emissions by about 3.8 Mt CO₂ (~80% reduction). This funding requirement is modest relative to the projected revenues generated under both the FPFA and CCA, suggesting that total long-term emissions reduction potential could be significantly larger if revenues are strategically reinvested.
The aluminum sector's combination of high import dependence, several high-intensity import sources, and unusually electricity-driven emissions profile means these findings should not be extrapolated to other industries without sector-specific analysis.
Policy design gaps
We have identified several cross-cutting policy design gaps in FPFA and CCA that must be addressed to ensure a durable and credible aluminum border carbon adjustment. Both the FPFA and the CCA require stronger supply risk safeguards, including mandatory pre-implementation supply and capacity assessments and statutory disruption triggers to prevent sudden import contractions and price spikes in a strategically important sector. Policymakers must also establish a unified digital carbon reporting and customs verification system to avoid fragmented enforcement across agencies. Clear operational guidance is needed to distinguish primary, secondary, and mixed aluminum products to prevent misclassification that could penalize low-carbon recycled material. In addition, Congress should clarify how carbon fees interact with existing tariffs to avoid unintended tariff stacking, create a transparent rules-based international equivalency framework to reduce legal and diplomatic risk, and strengthen anti-circumvention authority to address transshipment and carbon misreporting.
Each proposal also requires distinct structural refinements. Under the FPFA, a calibrated phase-in schedule would reduce the risk of first-year trade shocks, and linking a portion of revenue to U.S. aluminum decarbonization and modernization would strengthen both competitiveness and climate alignment and reduce perceptions of protectionism. The CCA should abandon the use of economy wide emissions intensity values or restrict use for smaller exporting countries in favor of physical basis carbon intensity (ton CO2/ton aluminum) and establish strict audit and documentation rules for export rebates to avoid overcompensation and WTO vulnerability. More policy design recommendations are presented in Chapter 8 of this report. Addressing these design considerations in statute will be critical to ensuring that either policy framework functions as a credible climate instrument that supports domestic manufacturing rather than an administratively complex trade measure.
Final thoughts
The analysis highlights important distinctions between the FPFA and the CCA in terms of trade disruption speed, disruption tolerance, and policy coherence. The FPFA is a blunt instrument. It delivers high protection and rapid decoupling from high-carbon suppliers. It generates significant early revenue (that goes to the US treasury and not specifically toward decarbonization) but creates high disruption risk, potential supply gaps, and volatile fiscal outcomes.
The CCA is a precision tool. It integrates domestic and border carbon pricing, creates gradual trade shifts, and maintains more stable revenue for domestic and international decarbonization. It introduces greater administrative complexity but offers stronger long-term climate alignment.
From a strategic perspective, the core trade-off is between immediate protection and managed transition. The FPFA maximizes short-term border impact but carries higher supply and volatility risk. The CCA supports a slower but more stable structural adjustment. Based on our modeling results and policy design analysis, the evidence favors a structured carbon pricing approach with strong supply risk safeguards. A CCA-style framework, strengthened by the use of physical-basis carbon intensity instead of economy-wide emissions intensity, and clear coordination with existing trade measures, provides a more durable pathway for aligning competitiveness and decarbonization objectives.
Ultimately, the effectiveness of a U.S. aluminum border carbon adjustment will depend less on headline tariff levels and more on careful statutory design, enforcement capacity, revenue reinvestment, decarbonization potential, and alignment with broader industrial and climate strategy. Thoughtful implementation choices will determine whether the policy functions as a stable climate instrument or as a disruptive trade measure.
To read the full report and see complete results and analysis of this new study, download the full report from the link above.
Interested in data and decarbonization studies on the global steel industry? Check out our list of aluminum industry publications on this page.
Don't forget to follow us on LinkedIn and X to get the latest about our new blog posts, projects, and publications.