
American Made, Deployed Everywhere: U.S. Opportunities in Industrial Decarbonization Technologies
Authors: Ali Hasanbeigi and Ben Ladabaum
This executive summary is a preview of our full report on industrial decarbonization markets. The full report will be released later in Fall 2026.
Industrial process heat is the largest source of energy demand and direct emissions in manufacturing, and most of it is still produced by burning fossil fuels on site. Technologies that can reduce or replace this fuel use are now commercially available or approaching commercial scale. The countries whose firms establish manufacturing capacity, reference projects, and supply chains early will gain lasting advantages in cost, operating experience, exports, and technical standards.
Industrial decarbonization technologies are therefore becoming an increasingly important global manufacturing market. China, the European Union, Japan, South Korea, and other economies are already investing to strengthen their domestic capabilities. Understanding the size and timing of these markets, and the United States’ position within them, is important for industrial, economic, trade, and climate policy.
This study estimates the U.S. opportunity across six priority technologies. It quantifies their obtainable markets in the U.S. and globally, potential U.S. revenue and employment, associated emissions reductions, and the manufacturing and policy conditions that will determine whether the United States captures this value domestically or relies more heavily on imports.
From a list of 25 industrial decarbonization technologies, we selected six for detailed analysis:
1. Advanced process controls (APC) / AI and digitalization
2. High-temperature industrial heat pumps
3. Electric boilers
4. Thermal energy storage (TES)
5. Methane pyrolysis
6. Small modular reactors (SMRs) for industrial heat
Industrial heat pumps, electric boilers, and thermal energy storage are electricity-based pathways for supplying industrial heat. APC / AI and digitalization reduce energy use and emissions in existing facilities. Methane pyrolysis produces low carbon hydrogen for use as a chemical feedstock or as a reductant in steelmaking. The methane pyrolysis market in this study is based on current industrial hydrogen demand for those two uses. Hydrogen combustion for process heat is technically possible but is not an optimal use of clean hydrogen and is outside the scope of this analysis. SMRs could provide firm, high-temperature steam and heat for selected industrial applications. The technologies were selected based on emissions reduction potential, technology readiness, U.S. competitive position, manufacturing and export potential, scalability, capital intensity, cross-sector applicability, and policy alignment.
For each technology market size, we calculated the following:
· Total addressable market (TAM): capital value of all technically addressable applications, at full installed cost.
· Serviceable addressable market (SAM): share of TAM economically and operationally serviceable in each period.
· Serviceable obtainable market (SOM): deployment-related investment obtainable given provider capacity and realistic pace of customer adoption in each period. SAM is what could be served; SOM is the share actually won, reflecting supplier delivery capacity, procurement cycles, and the pace of customer acceptance.
Our analysis represents a policy-enabled transition scenario under which supportive policies, clean and affordable electricity, project financing, and supply chain expansion are available. It is not an unconditional forecast. The scenario does not assume that electricity reaches price parity with natural gas; the serviceable market in each period is set by the readiness assessment described in Chapter 2.
What can be achieved by 2030 and 2040
The obtainable market is relatively modest during the 2020s and 2030s but expands rapidly after 2040. Across the six technologies, the overlap-adjusted world SOM reaches approximately $9 billion cumulatively by 2030 and $67 billion by 2040. The corresponding U.S. totals are approximately $2.4 billion and $13 billion. Less than one-sixth of the cumulative 2060 market is therefore reached by 2040.
The relatively small near-term market does not mean that the commercial technologies are unproven. Electric boilers and industrial heat pumps have been used for decades. Rather, decarbonization-driven adoption remains at an early stage, and the installed clean technology fleet is still small relative to the fossil fuel equipment it could eventually replace. Thermal energy storage, methane pyrolysis, and SMRs are also at earlier stages of commercial development, so their deployment increases gradually before accelerating in later periods.
The 2030s are nevertheless the decisive market formation period. The first large orders, operating reference fleets, supplier relationships, manufacturing investments, and financing structures will influence which companies supply the much larger post-2040 market. Experience in solar, batteries, and electric vehicles shows that manufacturing leadership is often established well before demand reaches its peak. The relevant decision window for industrial decarbonization technologies is therefore the next several years, not the 2040s.
The full-horizon results reveal both the scale of the opportunity and its concentration in a few large technology markets. Industrial heat pumps have the largest standalone world and U.S. SOM, followed by electric boilers, SMRs, and thermal energy storage. APC / AI and digitalization has a smaller capital market but begins scaling earlier and offers strong U.S. capabilities in software, controls, and integration. Methane pyrolysis has the smallest market but may remain strategically important for industrial hydrogen applications mainly as feedstock in the chemical industry and reductant in the steel industry (Figure ES1).
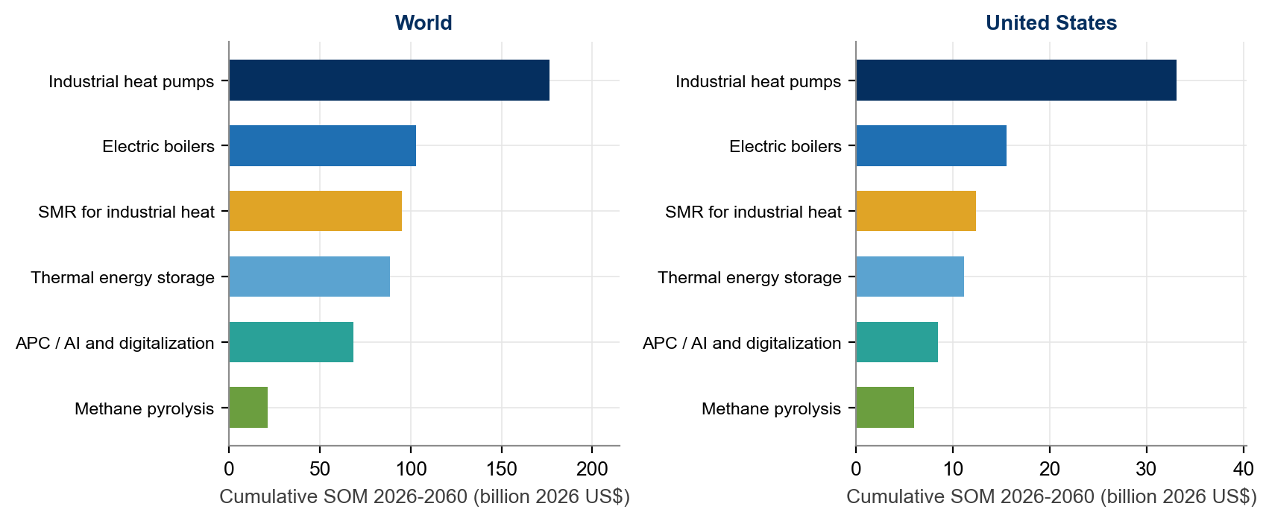
Figure ES1. Cumulative serviceable obtainable market (SOM) by technology, world and United States, 2026 to 2060.
Notes: Values are standalone per technology and are not additive across technologies; the additive overlap-adjusted portfolio totals are $463 billion (world) and $73 billion (United States).
The scale that follows: 2050 and 2060
By 2060, the overlap-adjusted world SOM reaches approximately $463 billion cumulatively, equivalent to about $13 billion per year when averaged across the 35-year study period. The corresponding U.S. SOM is approximately $73 billion. These cumulative values represent deployment-related investment between 2026 and 2060, not annual market values.
The standalone technology results illustrate the different forms of opportunity. Industrial heat pumps and electric boilers offer the largest electrified heat markets. Thermal energy storage supports greater use of low cost and variable electricity. APC / AI and digitalization offers an earlier and more software-intensive opportunity as well as quick paybacks for industrial end users. SMRs and methane pyrolysis have smaller obtainable markets but could serve selected high-temperature heat and industrial hydrogen applications that are more difficult to electrify.
Table. Results at a glance. Market and deployment values are cumulative 2026-2060, in real 2026 US$.
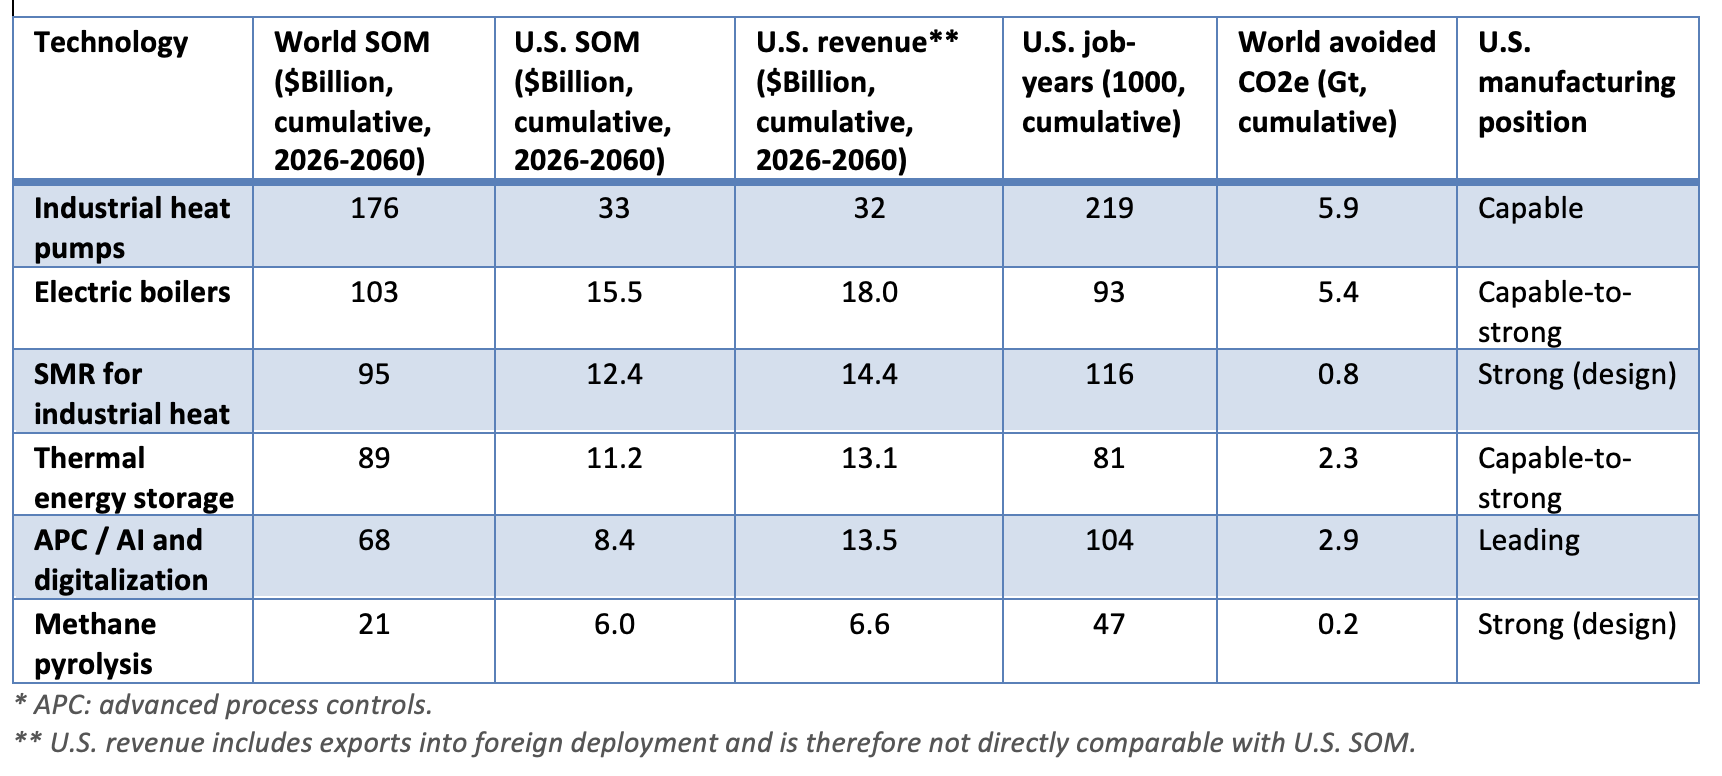
If the SOM is captured, U.S. deployment and exports support approximately $82 billion in overlap-adjusted U.S.-captured revenue between 2026 and 2060. This is equivalent to about $2.3 billion per year on average and nearly $3.5 billion per year during the 2040s peak. The associated employment reaches approximately 579,000 job-years, equivalent to about 16,600 jobs supported per year on average and approximately 23,500 per year during the peak decade. These are revenue and employment effects (direct, indirect, and induced) associated with the estimated investment, not net economy-wide impacts.
The composition of this revenue differs by technology. Installation and engineering, procurement, and construction account for a large share of domestic value in the hardware technologies and generally remain local even when some equipment is imported. APC / AI and digitalization and methane pyrolysis capture relatively larger shares through manufacturing, engineering, software, licensing, and exports. Industrial heat pumps stand out because the largest U.S. market is also the most dependent on imported large steam systems. This makes the technology both the largest import exposure and the largest targeted onshoring opportunity in the portfolio (Figure ES2).
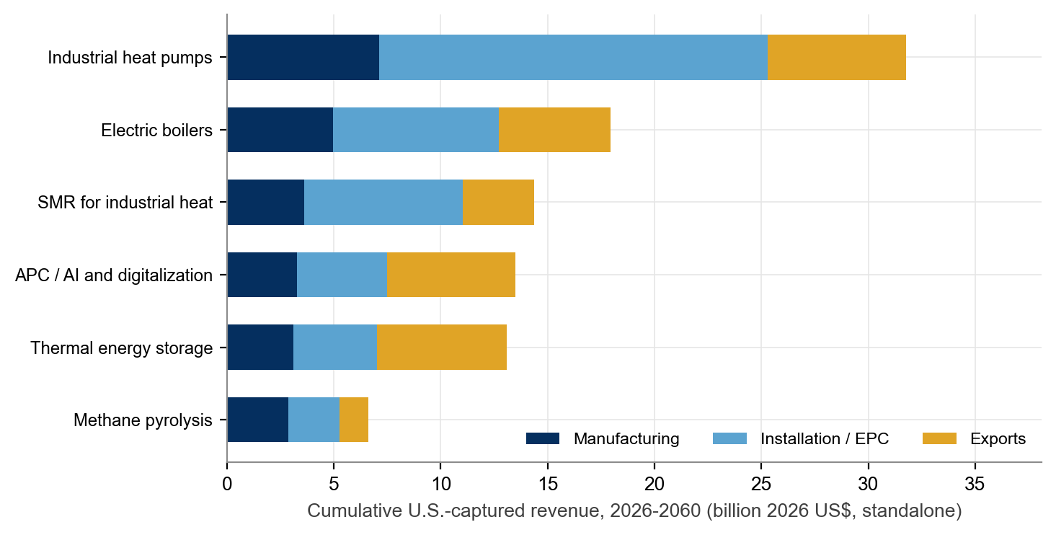
Figure ES2. U.S.-captured revenue by technology and value chain component if the technologies' SOM is captured, cumulative 2026 to 2060, standalone per technology.
The associated emissions reductions also grow substantially over time. Overlap-adjusted cumulative avoided emissions reach approximately 13.1 Gt CO₂e worldwide through 2060. Annual avoided emissions rise to about 0.86 Gt CO₂e during the 2050s, a scale close to 10 percent of current annual global industrial CO₂ emissions. The portfolio’s emissions contribution accelerates as deployment expands and electricity systems become cleaner. Industrial heat pumps and electric boilers provide the largest cumulative reductions because they displace large fossil fuel heat loads. APC / AI and digitalization begins contributing earlier by reducing energy consumption in existing plants, while thermal energy storage enables greater use of clean electricity. SMRs and methane pyrolysis contribute less in total but address selected applications where direct electrification may be more difficult (Figure ES3).
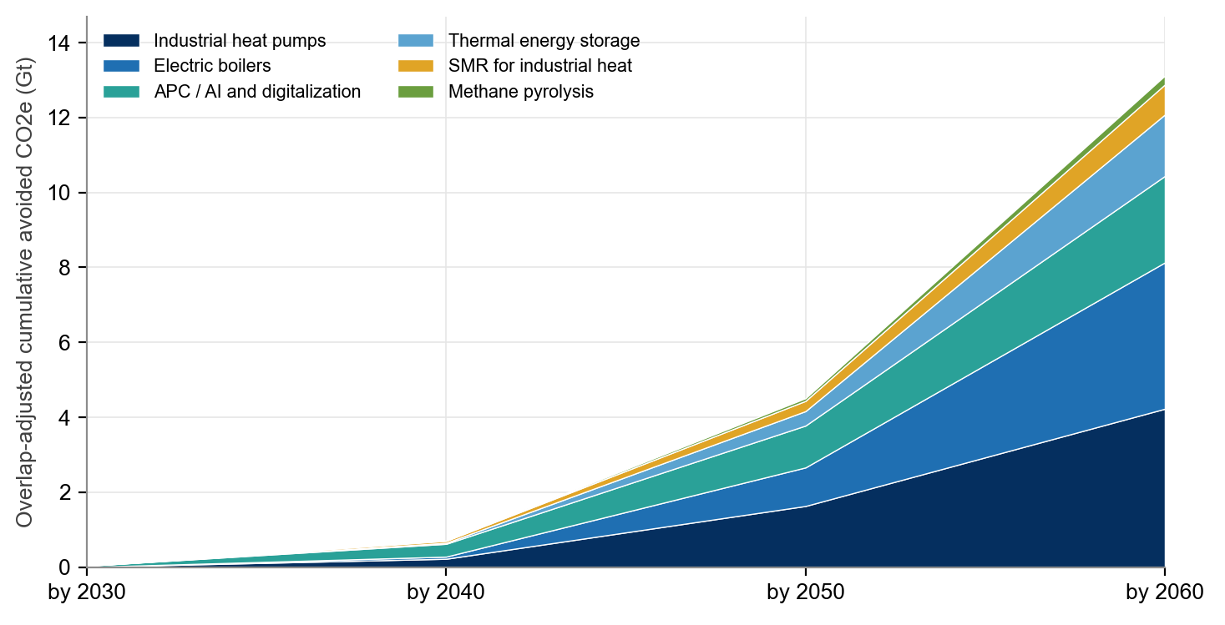
Figure ES3. Overlap-adjusted global cumulative avoided CO2e by technology if the technologies' SOM is captured worldwide, through each milestone.
U.S. manufacturing opportunities
The United States manufactures and supplies more of these technologies than is commonly assumed. It holds its strongest positions in design- and intellectual-property-intensive segments, particularly APC / AI and digitalization, methane pyrolysis process design, and advanced SMR engineering. These strengths are supported by domestic capabilities in instrumentation, controls, components, engineering, and systems integration.
The principal hardware gaps are narrow and specific rather than broad. Import dependence is concentrated in multi-megawatt high-temperature steam heat pumps, selected thermal storage media, MVR blowers, and ultra-heavy nuclear forgings. The United States already has credible production capabilities in electric boilers, lower-temperature heat pumps, thermal storage system design, controls, and many supporting components.
The relationship between market size and competitive position indicates that different technologies require different strategies. Industrial heat pumps combine the largest U.S. SOM, approximately $33 billion, with the weakest current manufacturing position. APC / AI and digitalization has the strongest position but a smaller capital market. Electric boilers and thermal energy storage fall between these cases: domestic capabilities exist, but larger reference fleets and early factory-scale orders are needed to convert that capability into stronger market share.
The implication is not that the United States should attempt to manufacture every component domestically. It should defend and export the segments in which it already leads, establish domestic reference fleets where capability exists, and selectively onshore high-value hardware segments where the market is large and the remaining gap is realistically closable (Figure ES4).
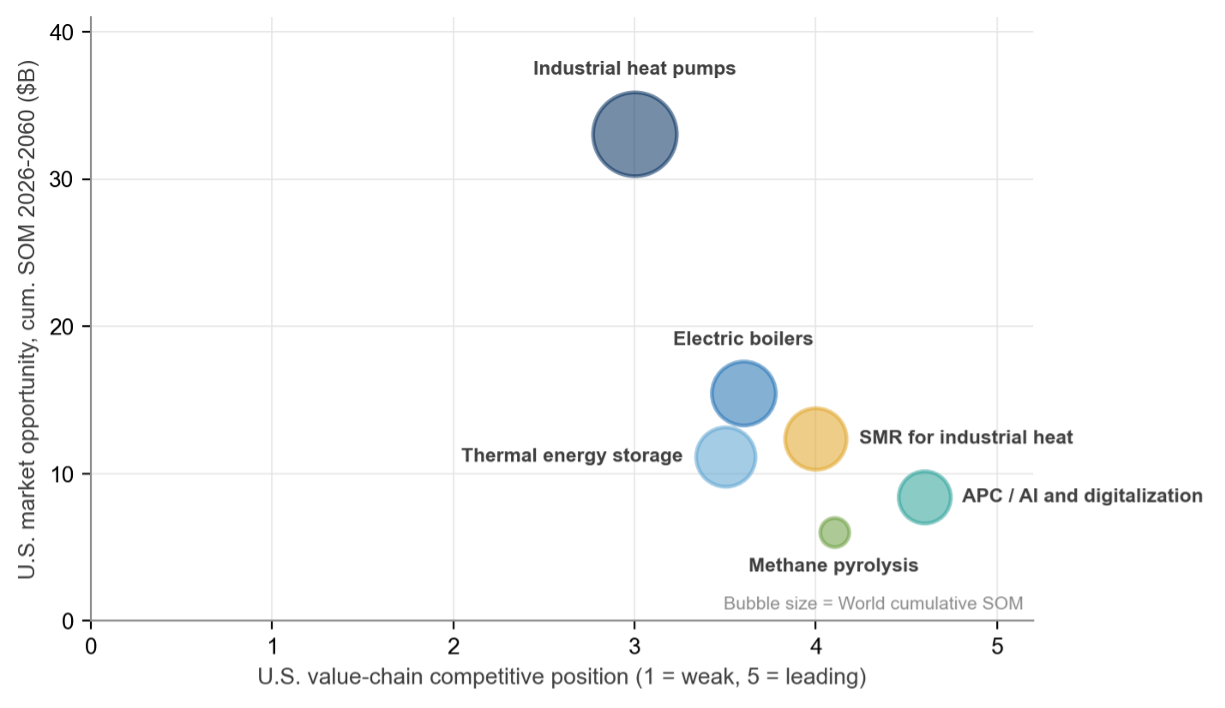
Figure ES4. U.S. value chain competitive position versus U.S. market opportunity (cumulative SOM 2026 to 2060), by technology. Bubble size is proportional to the world market.
Policy recommendations and sequencing
Federal policy support is uneven across the six technologies. SMRs have the strongest current policy foundation, including technology-neutral clean electricity credits, federal loan authority, demonstration support, fuel supply programs, and licensing modernization. On the supply side, certain qualifying thermal battery modules may be eligible for the Section 45X advanced manufacturing production credit. On the deployment side, thermal energy storage may have access to a strong investment tax credit, although its value depends on whether Section 48E covers storage that delivers industrial process heat directly.
Industrial heat pumps and electric boilers, the two largest deployment markets, have no dedicated federal instrument addressing their central operating cost barrier, the ratio of electricity to fuel prices. They depend on energy efficiency programs, state policies, electricity market conditions, and indirect support from clean power deployment. Methane pyrolysis has the weakest policy fit. It can reach the Section 45V credit only through a facility-specific provisional emissions rate, the credit closes to projects that have not begun construction by the end of 2027, and no instrument addresses first project financing or the solid carbon co-product economics that govern its scale.
The timing of the remaining policy instruments adds urgency. Many tax credits, financing authorities, and program runways expire or begin stepping down between 2028 and 2032, just as the 2030s project pipeline should be forming. Our recommended policy actions vary in both difficulty and market reach. Clarifying Section 48E eligibility for thermal energy storage that delivers process heat is a narrow but high-value action relevant to approximately $11 billion in cumulative U.S. SOM. Some configurations qualify today, but the statute ties thermal storage property to HVAC systems, so stand-alone process heat storage remains uncertain. Clarity could come through Treasury guidance where the statute permits or through a narrow statutory technical correction.
The broadest demand-side action is a package combining public procurement, including federal facility procurement and Buy Clean-type product standards, long-term offtake commitments, and state clean heat standards. It is relevant to approximately $68 billion in cumulative U.S. SOM across four commercial and near-commercial technologies. Electricity rate, demand charge, and interconnection reform affects approximately $60 billion across industrial heat pumps, electric boilers, and thermal energy storage.
A clean heat production incentive is more difficult to establish because it requires new legislation, but it is also one of the most consequential recommendations. It would directly address the electricity-to-gas price gap that constrains the operating economics of electrified industrial heat. Capital incentives lower upfront costs but do not change the electricity-to-gas price ratio that governs operating economics. Rate and demand charge reform and an adequate supply of low-cost clean electricity narrow that gap structurally, so a production incentive is best designed as a time-limited bridge during market formation rather than a permanent subsidy.
Figure ES5 should therefore be read as a portfolio and sequencing framework, not as a ranking. Lower-difficulty administrative and regulatory actions create the conditions needed for larger legislative programs to work. At the same time, those near-term actions cannot fully replace structural measures addressing operating costs, first project risk, and domestic supply chains.
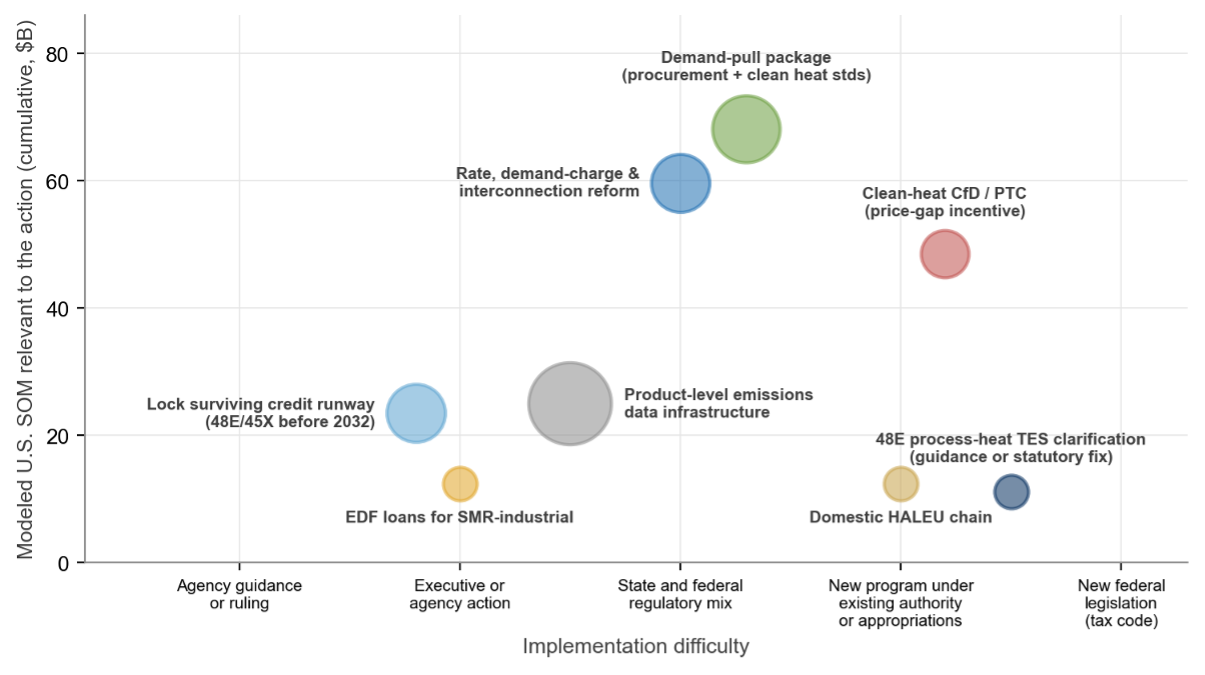
Figure ES5. Recommended actions by implementation difficulty and the U.S. SOM relevant to each action (cumulative 2026 to 2060). Bubble size is the number of technologies affected.
Notes: Values are exposure measures (the market each action is relevant to), not incremental deployment caused by the action, and overlapping markets are not additive across bubbles. The horizontal axis separates actions that need only agency guidance or existing authority from those that need a new program under existing authority or appropriations, and from those that need new legislation such as a tax credit. The emissions data bubble refers to product-level emissions intensity data of the kind the PROVE IT Act would have DOE produce; it underpins procurement standards, border carbon measures, and low carbon product qualification rather than creating a market by itself.
Sequencing is as important as policy design. Near-term priorities include creating demand through procurement and offtake, reforming electricity rates and interconnection, integrating APC and industrial heat pumps into utility efficiency and electrification programs, resolving Section 48E treatment of process heat storage, deploying federal financing for first industrial SMR projects, completing the domestic HALEU supply chain, and establishing the first commercial reference fleets. Industrial capital cycles mean that an order placed in 2030 may need to enter corporate budgeting, engineering, and utility planning processes in 2027.
The market opportunity for the United States is substantial, but it is not guaranteed. Other countries, particularly China, are investing to strengthen manufacturing capacity, reduce costs, and establish positions in future export markets. The United States has the technical capabilities, industrial base, and innovation ecosystem needed to compete successfully. However, decisions made during the next several years will determine whether U.S. firms capture a leading share of these markets or whether future domestic and global deployment relies increasingly on technologies and supply chains established elsewhere.
This executive summary is a preview of our full report on industrial decarbonization markets. The full report will be released later in Fall 2026.
Don't forget to follow us on LinkedIn and X to get the latest about our new blog posts, projects, and publications.