Author: Ali Hasanbeigi, Ph.D.

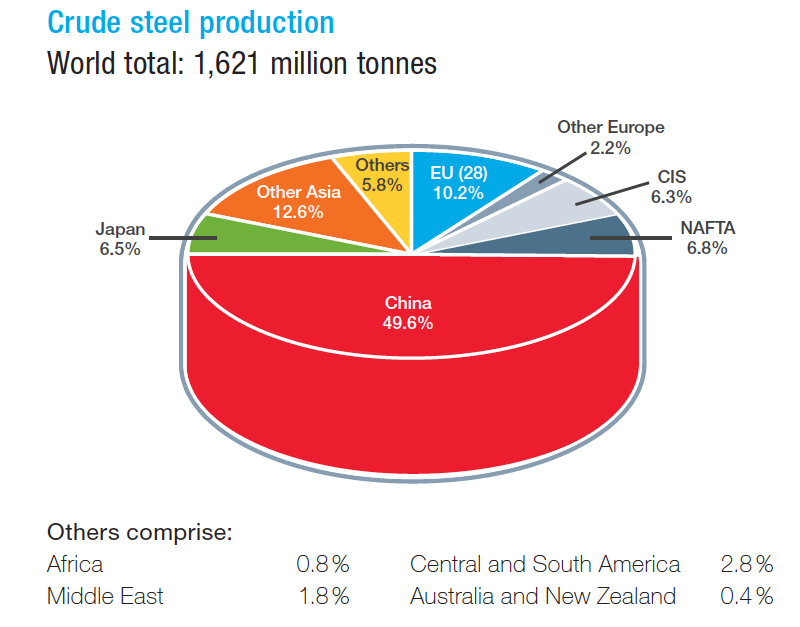
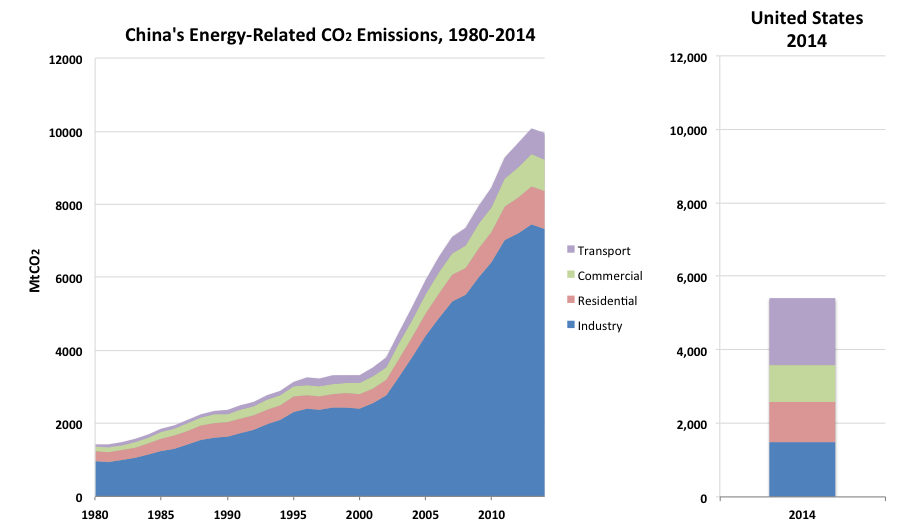
Production of iron and steel is an energy-intensive and air polluting manufacturing process. In 2014, the iron and steel industry accounted for around 28 percent of primary energy consumption of Chinese manufacturing (NBS 2015a). Steel production in 2015 was 804 Mt (worldsteel, 2016), representing 49.5% of the world production that year (Figure 1).

Figure 1. China’s Crude Steel Production and Share of Global Production (1990-2015) (EBCISIY, various years; NBS, 2015b, worldsteel 2016)
Chinese steel industry contributed to about 20% of SO2 emissions, and 27% of dust and PM emissions for all key manufacturing industry in China in 2013 (Wang et al. 2016).
China also produces over half of the world’s cement with 2,360 million Mt produced in China in 2015 (NBS 2015b). Two types of kilns are used in China to produce clinker, which is the key ingredient in cement: vertical shaft kilns and rotary kilns. Vertical shaft kilns are outdated technologies that use significantly more energy to produce a ton of clinker than rotary kilns do. The cement production from rotary kilns grew rapidly in recent years, from 116 Mt in 2000 to 1,494 Mt in 2010 (Figure 2).

Note: 2011 – 2015 production shares are based on our model projections
Figure 2. Cement production in China by kiln type, 1990-2015 (ITIBMIC 2004, MIIT 2011, NBS 2015b)
Consistent with the Chinese cement industry’s large production volume, total CO2 emissions from the industry are very high, as are associated air pollutant emissions, including sulfur dioxide (SO2), nitrogen oxides (NOX), carbon monoxide (CO), and particulate matter (PM). These emissions cause significant regional and global environmental problems. The cement industry is the largest source of PM emissions in China, accounting for 40 percent of PM emissions from all industrial sources and 27 percent of total national PM emissions (Lei et al. 2011).
In addition to setting emissions standard and adoption of end-of-pipe emissions control technologies, Chinese government policies also focus on reducing energy use, which, in turn, helps to reduce greenhouse gas (GHG) emissions. Other important co-benefits of energy-efficiency policies and programs are reduced harm to human health through reduction in air pollutant emissions, reduced corrosion, and reduction in crop losses caused by surface ozone and regional haze.
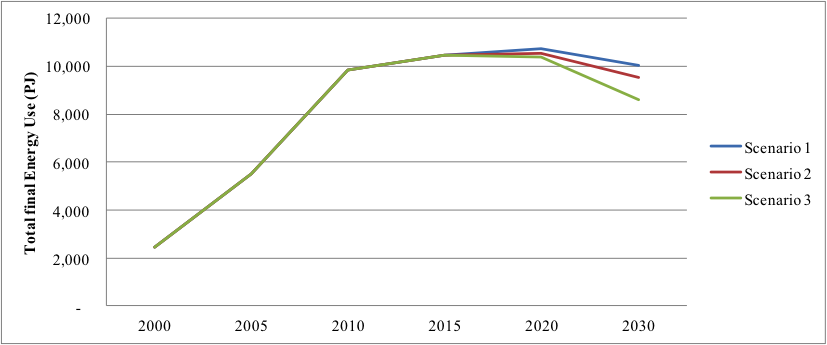
In early 2017, my colleagues at Lawrence Berkeley National Laboratory and I published a study in which we analyzed and projected the total particulate matter (PM) and sulfur dioxide (SO2) emissions from the Chinese cement and steel industry during 2010-2050 under three different scenarios. We used the bottom-up emissions control technologies data to make the emissions projections. The three distinct scenarios developed were as follow:
Base Case Scenario: a baseline scenario that assumes that only policies in place in 2010 continue to have effect, and autonomous technological improvement (including efficiency improvement and fuel switching) occurs. The end-of-pipe emissions control technologies shares and penetration remain at 2010 level through the study period up to 2050.
Advanced scenario: China meets its energy needs and improves its energy security and environmental quality by deploying the maximum feasible share of currently cost-effective energy efficiency and renewable supply technologies by 2050. The end-of-pipe emissions control technologies share and penetration remain at 2010 level through the study period up to 2050.
Advanced scenario with Improved End-of-Pipe (EOP) Emissions Control (Advanced EOP): Similar to Advanced scenario explained above with the only difference being the end-of-pipe emissions control technologies share and penetration rate improves through the study period up to 2050.
In all three scenarios, only technologies that are commercialized or piloted at scale are considered. Following figures show the result of our analyses.

Figure 3. Total PM emissions of Chinese cement industry under different scenarios during 2010-2050

Figure 4. Total SO2 emissions of Chinese cement industry under different scenarios during 2010-2050

Figure 5. Total PM emissions of Chinese steel industry under different scenarios during 2010-2050

Figure 6. Total SO2 emissions of Chinese steel industry under different scenarios during 2010-2050
More details of the methodology used and results can be found in our report which is published on LBNL’s website and can be downloaded from this Link. Please feel free to contact me if you have any question.
Don't forget to Follow us on LinkedIn and Facebook to get the latest about our new blog posts, projects, and publications.
Some of our related publications are:
Hasanbeigi, Ali; Arens, Marlene; Rojas-Cardenas, Jose; Price, Lynn; Triolo, Ryan. (2016). Comparison of Carbon Dioxide Emissions Intensity of Steel Industry in China, Germany, Mexico, and the United States. Resources, Conservation and Recycling. Volume 113, October 2016, Pages 127–139
Zhang, Qi; Hasanbeigi, Ali; Price, Lynn; Lu, Hongyou; Arens, Marlen (2016). A Bottom-up Energy Efficiency Improvement Roadmap for China’s Iron and Steel Industry up to 2050. Berkeley, CA: Lawrence Berkeley National Laboratory. LBNL- 1006356
Hasanbeigi, Ali; Morrow, William; Sathaye, Jayant; Masanet, Eric; Xu, Tengfang. (2013). A Bottom-Up Model to Estimate the Energy Efficiency Improvement and CO2 Emission Reduction Potentials in the Chinese Iron and Steel Industry. Energy, Volume 50, 1 February 2013, Pages 315-325
Hasanbeigi, Ali; Arens, Marlene; Price, Lynn; (2013). Emerging Energy Efficiency and CO2 Emissions Reduction Technologies for the Iron and Steel Industry. Berkeley, CA: Lawrence Berkeley National Laboratory BNL-6106E.
Hasanbeigi, Ali; Agnes Lobscheid; Yue Dai; Price, Hongyou, Lynn; Lu (2012). Quantifying the Co-benefits of Energy-Efficiency Programs: A Case-study for the Cement Industry in Shandong Province, China Berkeley, CA: Lawrence Berkeley National Laboratory. LBNL-5949E.
Hasanbeigi, Ali; Morrow, William; Masanet, Eric; Sathaye, Jayant; Xu, Tengfang. (2012). Assessment of Energy Efficiency Improvement and CO2 Emission Reduction Potentials in the Cement Industry in China. Berkeley, CA: Lawrence Berkeley National Laboratory. LBNL-5536E
Hasanbeigi, Ali; Price, Lynn; Lin, Elina. (2012). Emerging Energy Efficiency and CO2 Emissions Reduction Technologies for Cement and ConcreteProduction. Berkeley, CA: Lawrence Berkeley National Laboratory LBNL-5434E.
Hasanbeigi, Ali; Price, Lynn; Hongyou, Lu; Lan, Wang (2009). Analysis of Energy-Efficiency Opportunities for the Cement Industry in Shandong Province, China. Energy 35 (2010) 3461-3473
References
Hasanbeigi, Ali; Nina Khanna, Price, Lynn (2017). Air Pollutant Emissions Projection for the Cement and Steel Industry in China and the Impact of Emissions Control Technologies. Berkeley, CA: Lawrence Berkeley National Laboratory.
Editorial Board of China Iron and Steel Industry Yearbook (EBCISIY). Various years. China Iron and Steel Industry Yearbook. Beijing, China (in Chinese).
Institute of Technical Information for Building Materials Industry (ITIBMIC). 2004. “Final Report on Cement Survey.” Prepared for the United Nations Industrial Development Organization (UNIDO) for the Contract Entitled Cement Sub-sector Survey for the Project Energy Conservation and GHG Emissions Reduction in Chinese TVEs-Phase II.
Lei,Y., Q. Zhang, C. Nielsen, K. He. 2011. “An inventory of primary air pollutants and CO2 emissions from cement production in China, 1990-2020.” Atmospheric Environment 45:147-154.
Ministry of Industry and Information Technology (MIIT). 2011. Production of building materials industry in 2010 and rapid growth of output of major products.
NBS. 2015a. China Energy Statistics Yearbook 2015. Beijing: China Statistics Press.
NBS. 2015b. China Statistical Yearbook 2015. Beijing: China Statistics Press.
Wang, K., Tian, H., Hua, S., Zhu, C., Gao, J., Xue, Y., Hao, J., Wang, Y., Zhou, J. 2016. A comprehensive emissions inventory ofmultiple air pollutants from iron and steel industry in China: Temporal trends and spatial variation characteristics. Science of the Total Environment 559 (2016) 7–14.
World Steel Association (worldsteel). 2016. Steel Statistical Yearbook 2016.