Author: Ali Hasanbeigi, Ph.D.
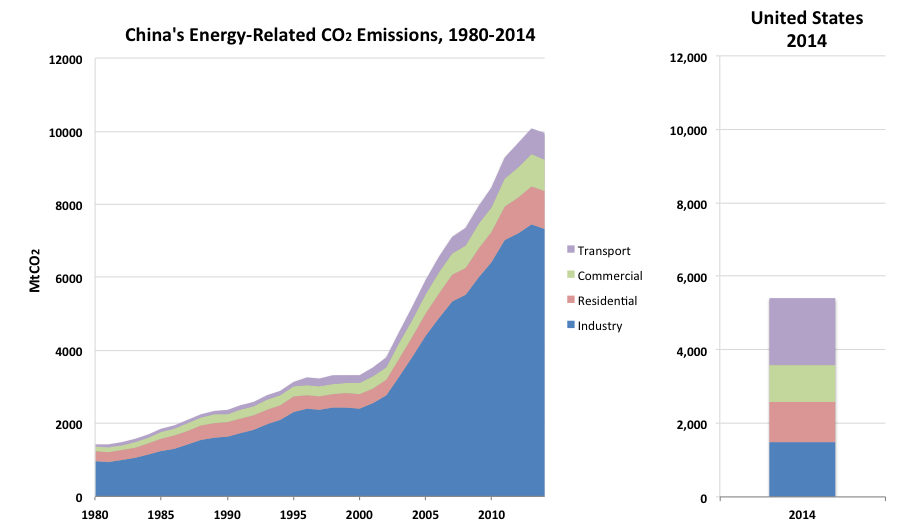
Production of iron and steel is an energy-intensive and air polluting manufacturing process. In 2014, the iron and steel industry accounted for around 28 percent of primary energy consumption of Chinese manufacturing (NBS 2015a). Steel production in 2015 was 804 Mt (worldsteel, 2016), representing 49.5% of the world production that year (Figure 1).

Figure 1. China’s Crude Steel Production and Share of Global Production (1990-2015) (EBCISIY, various years; NBS, 2015b, worldsteel 2016)
China is a developing country and the iron and steel industry, as a pillar industry for Chinese economic development, has grown rapidly along with the national economy. The average annual growth rate of crude steel production was around 18% between 2000 and 2010. China’s steel production in 2014 consumed around 580 TWh of electricity and 18,013 PJ of fuel (NBS 2015a).
The promotion and application of energy-saving technologies has become an important step for increasing energy efficiency and reducing energy consumption of steel enterprises, especially during the 11th Five Year Plan (FYP) (2006-2010) and 12th FYP (2011-2015). During this time, energy-efficiency technologies adopted in China’s steel industry included: Coke Dry Quenching (CDQ), Top-pressure Recovery Turbine (TRT), recycling converter gas, continuous casting, slab hot charging and hot delivery, Coal Moisture Control (CMC), and recycling waste heat from sintering. The penetration level of energy-efficiency technologies in the steel industry has improved greatly in China, improving its energy efficiency and emissions reductions (Hasanbeigi et al. 2011).
Couple of years ago, my colleagues and I conducted a study that aimed to analyze influential factors that affected the energy use of steel industry in the past in order to quantify the likely effect of those factors in the future. For the first time, we developed a decomposition analysis method that can be used for the steel industry to analyze the effect of different factors including structural change on energy use of the steel industry.
The factors we analyzed were:
Activity: Represents the total crude steel production.
Structure: Represents the activity share of each process route (Blast Furnace/Basic Oxygen Furnace (BF-BOF) or Electric Arc Furnace (EAF) route).
Pig iron ratio: The ratio of pig iron used as feedstock in each process route. This is especially important for the EAF process because the higher the pig iron ratio in the feedstock of the EAF, the higher the energy intensity of EAF steel production.
Energy intensity: Represents energy use per ton of crude steel
In that study, a bottom-up analysis of the energy use of key medium- and large-sized Chinese steel enterprises (which account for around 85% of steel production in China) was performed using data at the process level. Both retrospective and prospective analyses were conducted in order to assess the impact of factors that influence the energy use of the steel industry in the past and estimate the likely impact in the future up to 2030.
Three scenarios were developed as follows:
o Scenario 1: Low scrap usage: the share of EAF steel production grows slower and the pig iron feed ratio in EAF drops slower than other scenarios
o Scenario 2: Medium scrap usage: the rate of growth in the share of EAF steel production and the drop in the pig iron feed ratio in EAF production is medium (between scenario 1 and 3)
o Scenario 3: High scrap usage: the share of EAF steel production grows faster and the pig iron feed ratio in EAF production drops faster than other scenarios.
Figure 2 shows the energy intensities calculated for different steel production route up 2030

Figure 2. Final energy intensities calculated for key medium- and large-sized Chinese steel enterprises (2000-2030)
The results of our analysis showed that although total annual crude steel production of key Chinese steel enterprises (and most likely entire Chinese steel industry) is assumed to peak in 2030 under all scenarios, total final energy use of the key Chinese steel enterprises (and most likely the entire Chinese steel industry) peaks earlier, i.e. in year 2020 under low and medium steel scrap usage scenarios and in 2015 under high scrap usage scenario (Figure 3).
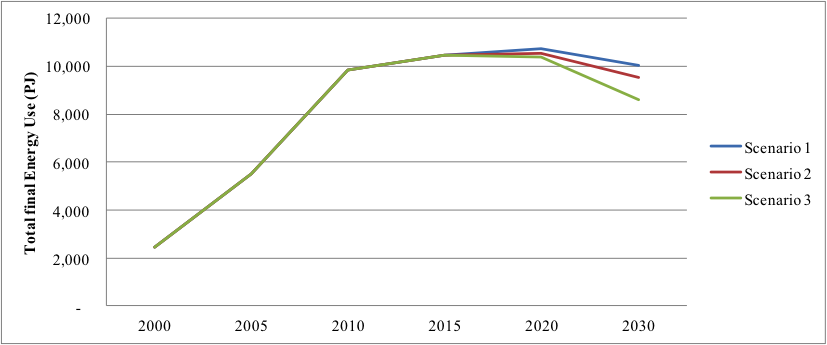
Figure 3. Total final energy use in key medium- and large-sized Chinese steel enterprises under each scenario (2000-2030)
Energy intensity reduction of the production processes and structural shift from Blast Furnace/Basic Oxygen Furnace (BF-BOF) to Electric Arc Furnace (EAF) steel production plays the most significant role in the final energy use reduction. The decomposition analysis results showed what contributed to the reduction in the final energy use and its peak under each scenario. Figure 4 shows an example of results for Medium scrap usage scenario.
The three scenarios produced for the forward looking decomposition analysis up to 2030 showed the structural effect is negative (i.e. reducing the final energy use) during 2010-2030 because of the increase in the EAF share of steel production in this period. Similarly, the pig iron ratio effect reduces the final energy use of key steel enterprises because of reduction in the share of pig iron used as feedstock in EAF steel production during this period. High scrap usage scenario had the largest structural effect and pig iron ratio effect because of higher EAF steel production and lower pig iron use in EAFs in this scenario.

Figure 4. Medium scrap usage scenario: Results of prospective decomposition of final energy use of key medium- and large-sized Chinese steel enterprises up to 2030
The intensity effect also played a significant role in reducing final energy use of steel manufacturing during 2010-2030. This is primarily because of the energy intensity assumptions for production processes in 2020 and 2030. While the realization of such energy intensity reduction is uncertain and remains to be seen in the future, the aggressive policies by the Chinese government to reduce the energy use per unit of product of the energy intensive sectors, especially the steel sector, are a promising sign that the Chinese steel industry is moving towards those energy intensity targets. The “Top-10,000 Enterprises Energy Saving Program” and the “10 Key Energy Saving Projects Program” along with other policies and incentives in the coming years will significantly help to reduce the energy intensity of the steel industry in China.
More details of our analysis and results are presented in our report that is published on LBNL’s website and can be downloaded from this Link.
Please feel free to contact me if you have any question. Don't forget to follow us on LinkedIn, Facebook, and Twitter to get the latest about our new blog posts, projects, and publications.
Some of our related publications are:
Hasanbeigi, Ali; Arens, Marlene; Rojas-Cardenas, Jose; Price, Lynn; Triolo, Ryan. (2016). Comparison of Carbon Dioxide Emissions Intensity of Steel Industry in China, Germany, Mexico, and the United States. Resources, Conservation and Recycling. Volume 113, October 2016, Pages 127–139
Zhang, Qi; Hasanbeigi, Ali; Price, Lynn; Lu, Hongyou; Arens, Marlen (2016). A Bottom-up Energy Efficiency Improvement Roadmap for China’s Iron and Steel Industry up to 2050. Berkeley, CA: Lawrence Berkeley National Laboratory. LBNL- 1006356
Morrow, William; Hasanbeigi, Ali; Sathaye, Jayant; Xu, Tengfang. 2014. Assessment of Energy Efficiency Improvement and CO2 Emission Reduction Potentials in India’s Cement and Iron & Steel Industries. Journal of Cleaner Production. Volume 65, 15 February 2014, Pages 131–141
Hasanbeigi, Ali; Price, Lynn, Aden, Nathaniel; Zhang Chunxia; Li Xiuping; Shangguan Fangqin. 2014. Comparison of Iron and Steel Production Energy Use and Energy Intensity in China and the U.S. Journal of Cleaner Production, Volume 65, 15 February 2014, Pages 108–119
Hasanbeigi, Ali; Morrow, William; Sathaye, Jayant; Masanet, Eric; Xu, Tengfang. (2013). A Bottom-Up Model to Estimate the Energy Efficiency Improvement and CO2 Emission Reduction Potentials in the Chinese Iron and Steel Industry. Energy, Volume 50, 1 February 2013, Pages 315-325
Hasanbeigi, Ali; Arens, Marlene; Price, Lynn; (2013). Emerging Energy Efficiency and CO2 Emissions Reduction Technologies for the Iron and Steel Industry. Berkeley, CA: Lawrence Berkeley National Laboratory BNL-6106E.
References
Editorial Board of China Iron and Steel Industry Yearbook (EBCISIY). Various years. China Iron and Steel Industry Yearbook. Beijing, China (in Chinese).
Hasanbeigi, A., Price, L., Aden, N., Zhang C., Li X., Shangguan F. 2011. A Comparison of Iron and Steel Production Energy Use and Energy Intensity in China and the U.S. Berkeley CA: Lawrence Berkeley National Laboratory Report LBNL-4836E.
NBS. 2015a. China Energy Statistics Yearbook 2015. Beijing: China Statistics Press.
NBS. 2015b. China Statistical Yearbook 2015. Beijing: China Statistics Press.
World Steel Association (worldsteel). 2016. Steel Statistical Yearbook 2016.